Bitcoin started a recovery wave above the $38,400 resistance against the US Dollar. BTC must clear $39,600 to move into a positive zone.
Bitcoin managed to stay above $37,650 and started an upside correction.
The price is now trading near $39,200 and the 100 hourly simple moving average.
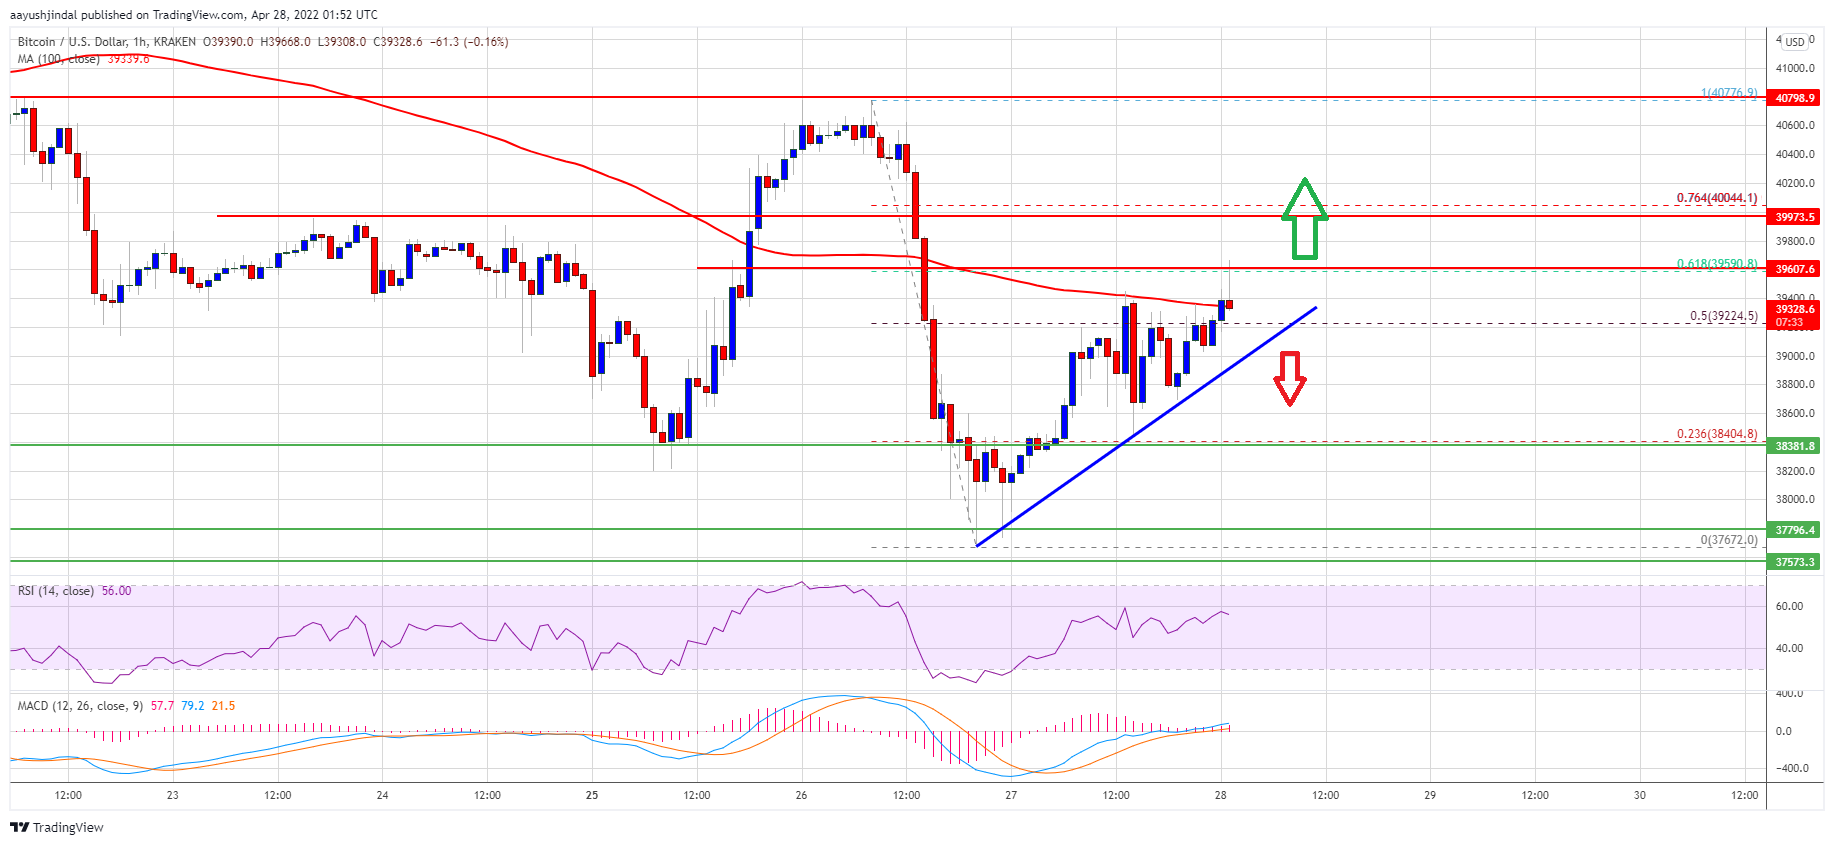
There is a key bullish trend line forming with support near $39,220 on the hourly chart of the BTC/USD pair (data feed from Kraken).
The pair must clear the $39,600 resistance to start a decent increase in the near term.
Bitcoin Price Recovers Ground
Bitcoin price formed a base above the $38,000 and started a recovery wave. BTC broke the $38,400 and $38,500 resistance levels.
There was a move above the 50% Fib retracement level of the key drop from the $40,775 swing high to $37,672 low. Bitcoin even climbed above the $39,500 level, but it faced sellers near the $39,600 level. It is now trading near $39,200 and the 100 hourly simple moving average.
There is also a key bullish trend line forming with support near $39,220 on the hourly chart of the BTC/USD pair. On the upside, an immediate resistance is near the $39,600 level.
The 61.8% Fib retracement level of the key drop from the $40,775 swing high to $37,672 low is also near the $39,600 level. The next key resistance could be near the $40,000 zone. A close above the $39,600 level and the 100 hourly simple moving average could open the doors for a decent increase.
Source: BTCUSD on TradingView.com
In the stated case, the price could even surpass the $40,000 resistance. The next major resistance may perhaps be near the $40,770 zone.
Fresh Decline in BTC?
If bitcoin fails to clear the $39,600 resistance zone, it could start a fresh decline. An immediate support on the downside is near the $39,250 level.
The next major support is seen near the trend line and $39,200. A close below the $39,200 support zone might start another decline. In the stated case, the price might drop to $38,400.
Technical indicators:
Hourly MACD – The MACD is slowly losing pace in the bullish zone.
Hourly RSI (Relative Strength Index) – The RSI for BTC/USD is now above the 50 level.
Major Support Levels – $39,200, followed by $38,400.
Major Resistance Levels – $39,600, $40,000 and $40,770.
Bitcoin started a recovery wave above the $38,400 resistance against the US Dollar. BTC must clear $39,600 to move into a positive zone.
Bitcoin managed to stay above $37,650 and started an upside correction.
The price is now trading near $39,200 and the 100 hourly simple moving average.
There is a key bullish trend line forming with support near $39,220 on the hourly chart of the BTC/USD pair (data feed from Kraken).
The pair must clear the $39,600 resistance to start a decent increase in the near term.
Bitcoin price formed a base above the $38,000 and started a recovery wave. BTC broke the $38,400 and $38,500 resistance levels.
There was a move above the 50% Fib retracement level of the key drop from the $40,775 swing high to $37,672 low. Bitcoin even climbed above the $39,500 level, but it faced sellers near the $39,600 level. It is now trading near $39,200 and the 100 hourly simple moving average.
There is also a key bullish trend line forming with support near $39,220 on the hourly chart of the BTC/USD pair. On the upside, an immediate resistance is near the $39,600 level.
The 61.8% Fib retracement level of the key drop from the $40,775 swing high to $37,672 low is also near the $39,600 level. The next key resistance could be near the $40,000 zone. A close above the $39,600 level and the 100 hourly simple moving average could open the doors for a decent increase.
Source: BTCUSD on TradingView.com
In the stated case, the price could even surpass the $40,000 resistance. The next major resistance may perhaps be near the $40,770 zone.
If bitcoin fails to clear the $39,600 resistance zone, it could start a fresh decline. An immediate support on the downside is near the $39,250 level.
The next major support is seen near the trend line and $39,200. A close below the $39,200 support zone might start another decline. In the stated case, the price might drop to $38,400.
Technical indicators:
Hourly MACD – The MACD is slowly losing pace in the bullish zone.
Hourly RSI (Relative Strength Index) – The RSI for BTC/USD is now above the 50 level.
Major Support Levels – $39,200, followed by $38,400.
Major Resistance Levels – $39,600, $40,000 and $40,770.
Tags: bitcoinbtcusdBTCUSDTxbtusd
FeedzyRead More
Bitcoin Magazine AnchorWatch Launches Nevada Trust Company, Caps Bitcoin Custody Fees at $10,000 a Month…
Bitcoin Magazine Super League Stockholders Approve Metaplanet’s 2,100 BTC Investment, Paving Way for ‘Superplanet’ Super…
Bitcoin Magazine The Architecture of Money: Mapping Financial Power in the Age of Bitcoin Money…
CME Group has scheduled the introduction of Bitcoin Cash and Uniswap futures for October 19,…
Bitcoin Magazine El Salvador’s National Bitcoin Office Hosts Five November Events Led by Herbert and…
Bitcoin Magazine No ‘Uptober’ Yet: Bitcoin Slips 2% in a Month That’s Historically Bullish Bitcoin’s…