Bitcoin is attempting an upside break above the $38,800 resistance zone against the US Dollar. BTC could rally further unless it fails to stay above $37,400.
Bitcoin started a fresh increase and was able to clear the $38,000 resistance zone.
The price is now trading above $37,500 and the 100 hourly simple moving average.
There was a break above a major bearish trend line with resistance near $37,450 on the hourly chart of the BTC/USD pair (data feed from Kraken).
The pair could continue to rise if there is a clear move above the $38,800 resistance zone.
Bitcoin Price Starts Fresh Increase
Bitcoin price corrected lower below the $38,000 pivot level. BTC even traded below $37,000, but the bulls were active near the $37,650. A low was formed near $36,667 and the price started a fresh increase.
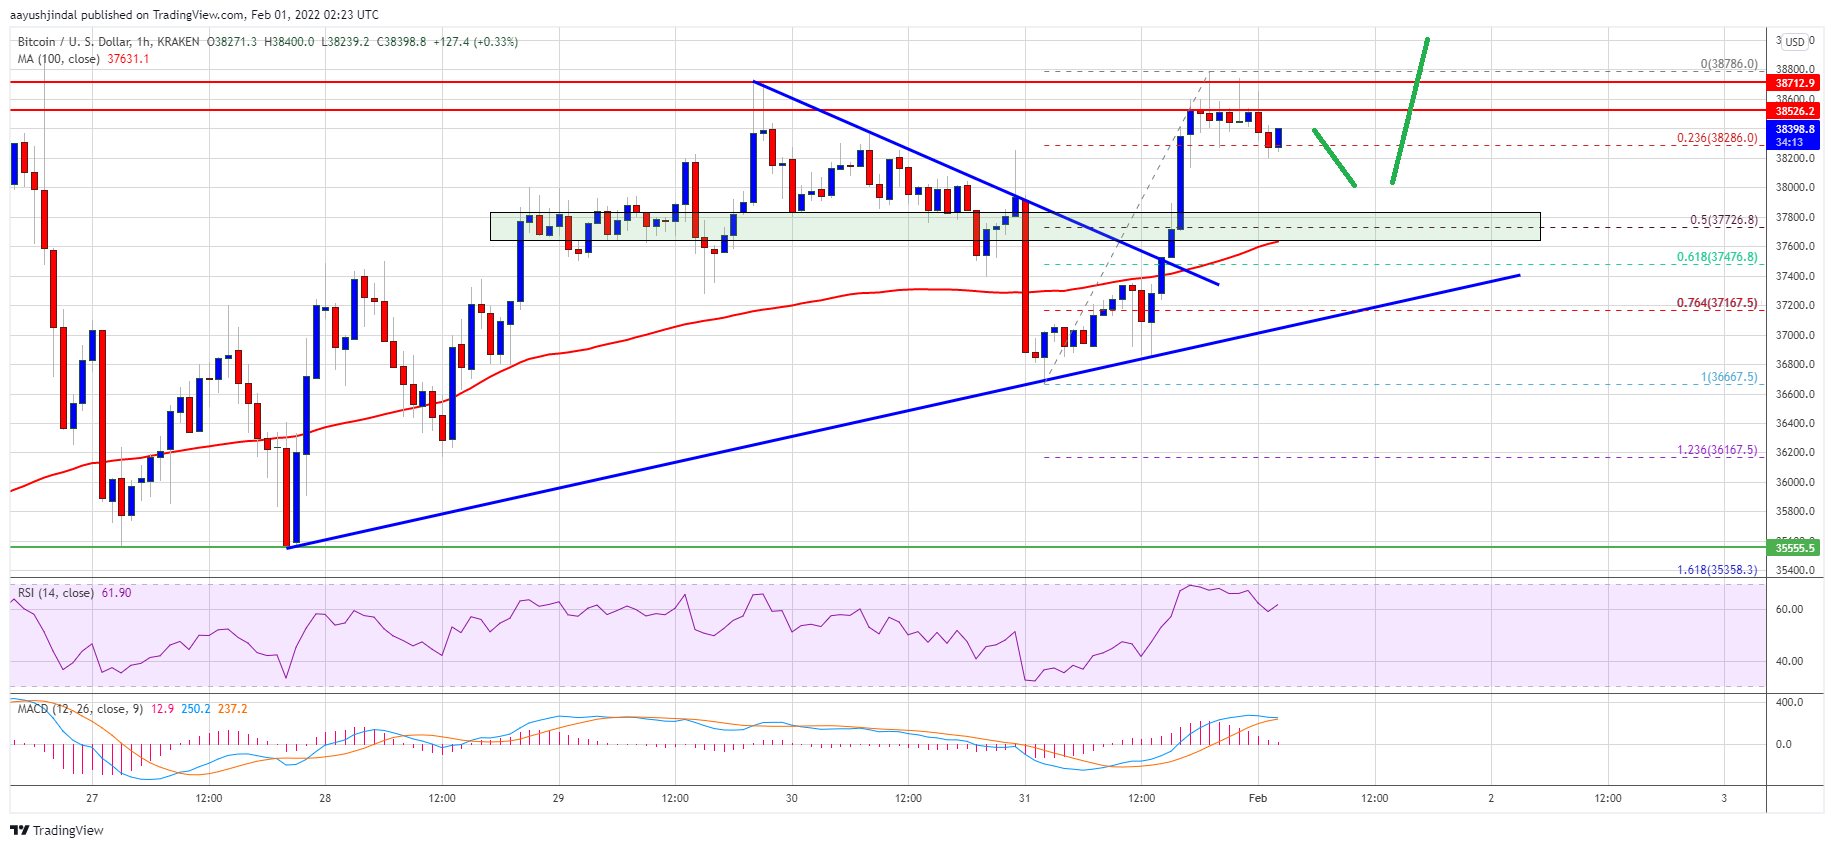
There was a clear move above the $37,500 resistance zone and the 100 hourly simple moving average. Besides, there was a break above a major bearish trend line with resistance near $37,450 on the hourly chart of the BTC/USD pair.
The pair surged above the $38,000 resistance zone. A high is formed near $38,786, and bitcoin is now facing a major resistance near the $38,800 zone.
It is currently trading near the 23.6% Fib retracement level of the upward move from the $36,667 swing low to $38,786 high. On the upside, an initial resistance is near the $38,500 level.
Source: BTCUSD on TradingView.com
The first major resistance is near the $38,800 zone. A clear move above the $38,800 zone could push the price further higher. The next key resistance is near the $39,500 zone. If the bulls able to clear the $39,500 level, the price may perhaps clear the $40,000 resistance zone.
Downsides Limited in BTC?
If bitcoin fails to start a fresh increase above $38,800, it could start a downside correction. An immediate support on the downside is near the $38,000 zone.
The first major support is seen near the $37,750 zone. It is near the 50% Fib retracement level of the upward move from the $36,667 swing low to $38,786 high. A downside break below the $37,500 support zone may perhaps push the price towards the $37,000 support zone.
Technical indicators:
Hourly MACD – The MACD is now losing momentum in the bullish zone.
Hourly RSI (Relative Strength Index) – The RSI for BTC/USD is now above the 50 level.
Major Support Levels – $37,500, followed by $37,000.
Major Resistance Levels – $38,500, $38,800 and $40,000.
Bitcoin is attempting an upside break above the $38,800 resistance zone against the US Dollar. BTC could rally further unless it fails to stay above $37,400.
Bitcoin started a fresh increase and was able to clear the $38,000 resistance zone.
The price is now trading above $37,500 and the 100 hourly simple moving average.
There was a break above a major bearish trend line with resistance near $37,450 on the hourly chart of the BTC/USD pair (data feed from Kraken).
The pair could continue to rise if there is a clear move above the $38,800 resistance zone.
Bitcoin price corrected lower below the $38,000 pivot level. BTC even traded below $37,000, but the bulls were active near the $37,650. A low was formed near $36,667 and the price started a fresh increase.
There was a clear move above the $37,500 resistance zone and the 100 hourly simple moving average. Besides, there was a break above a major bearish trend line with resistance near $37,450 on the hourly chart of the BTC/USD pair.
The pair surged above the $38,000 resistance zone. A high is formed near $38,786, and bitcoin is now facing a major resistance near the $38,800 zone.
It is currently trading near the 23.6% Fib retracement level of the upward move from the $36,667 swing low to $38,786 high. On the upside, an initial resistance is near the $38,500 level.
Source: BTCUSD on TradingView.com
The first major resistance is near the $38,800 zone. A clear move above the $38,800 zone could push the price further higher. The next key resistance is near the $39,500 zone. If the bulls able to clear the $39,500 level, the price may perhaps clear the $40,000 resistance zone.
If bitcoin fails to start a fresh increase above $38,800, it could start a downside correction. An immediate support on the downside is near the $38,000 zone.
The first major support is seen near the $37,750 zone. It is near the 50% Fib retracement level of the upward move from the $36,667 swing low to $38,786 high. A downside break below the $37,500 support zone may perhaps push the price towards the $37,000 support zone.
Technical indicators:
Hourly MACD – The MACD is now losing momentum in the bullish zone.
Hourly RSI (Relative Strength Index) – The RSI for BTC/USD is now above the 50 level.
Major Support Levels – $37,500, followed by $37,000.
Major Resistance Levels – $38,500, $38,800 and $40,000.
Tags: bitcoinbtcusdBTCUSDTxbtusd
FeedzyRead More
TL;DR Bitcoin is consolidating near $60,326.78 according to the supplied market check.The highlighted setup focuses…
TL;DR Bitcoin recently rebounded from the $58,000 area and was validated near $60,326.78 in the…
For years, investors had valued the firm well above its bitcoin holdings, giving Strategy massive…
TL;DR CryptoQuant-linked data shows Bitcoin apparent demand remaining negative for 208 consecutive days. The metric…
Ripple's Brad Garlinghouse called Strategy's preferred-stock funding model "financial engineering" that distracted the market, pointing…
Bitcoin’s latest pullback was not driven by a single headline. Instead, traders were hit by…