Bitcoin failed to stay above the $43,000 support against the US Dollar. BTC is trading in a bearish zone and could continue to move down below $41,200.
Bitcoin is struggling to climb above the $42,500 and $42,800 resistance levels.
The price is trading below $43,000 and the 100 hourly simple moving average.
There is a major bearish trend line forming with resistance near $42,800 on the hourly chart of the BTC/USD pair (data feed from Kraken).
The pair could start a major increase if there is a clear move above the $43,000 resistance.
Bitcoin Price Is Showing Bearish Signs
Bitcoin price failed to accelerate higher above the $43,500 resistance zone. As a result, there was a bearish reaction below the $43,000 pivot level.
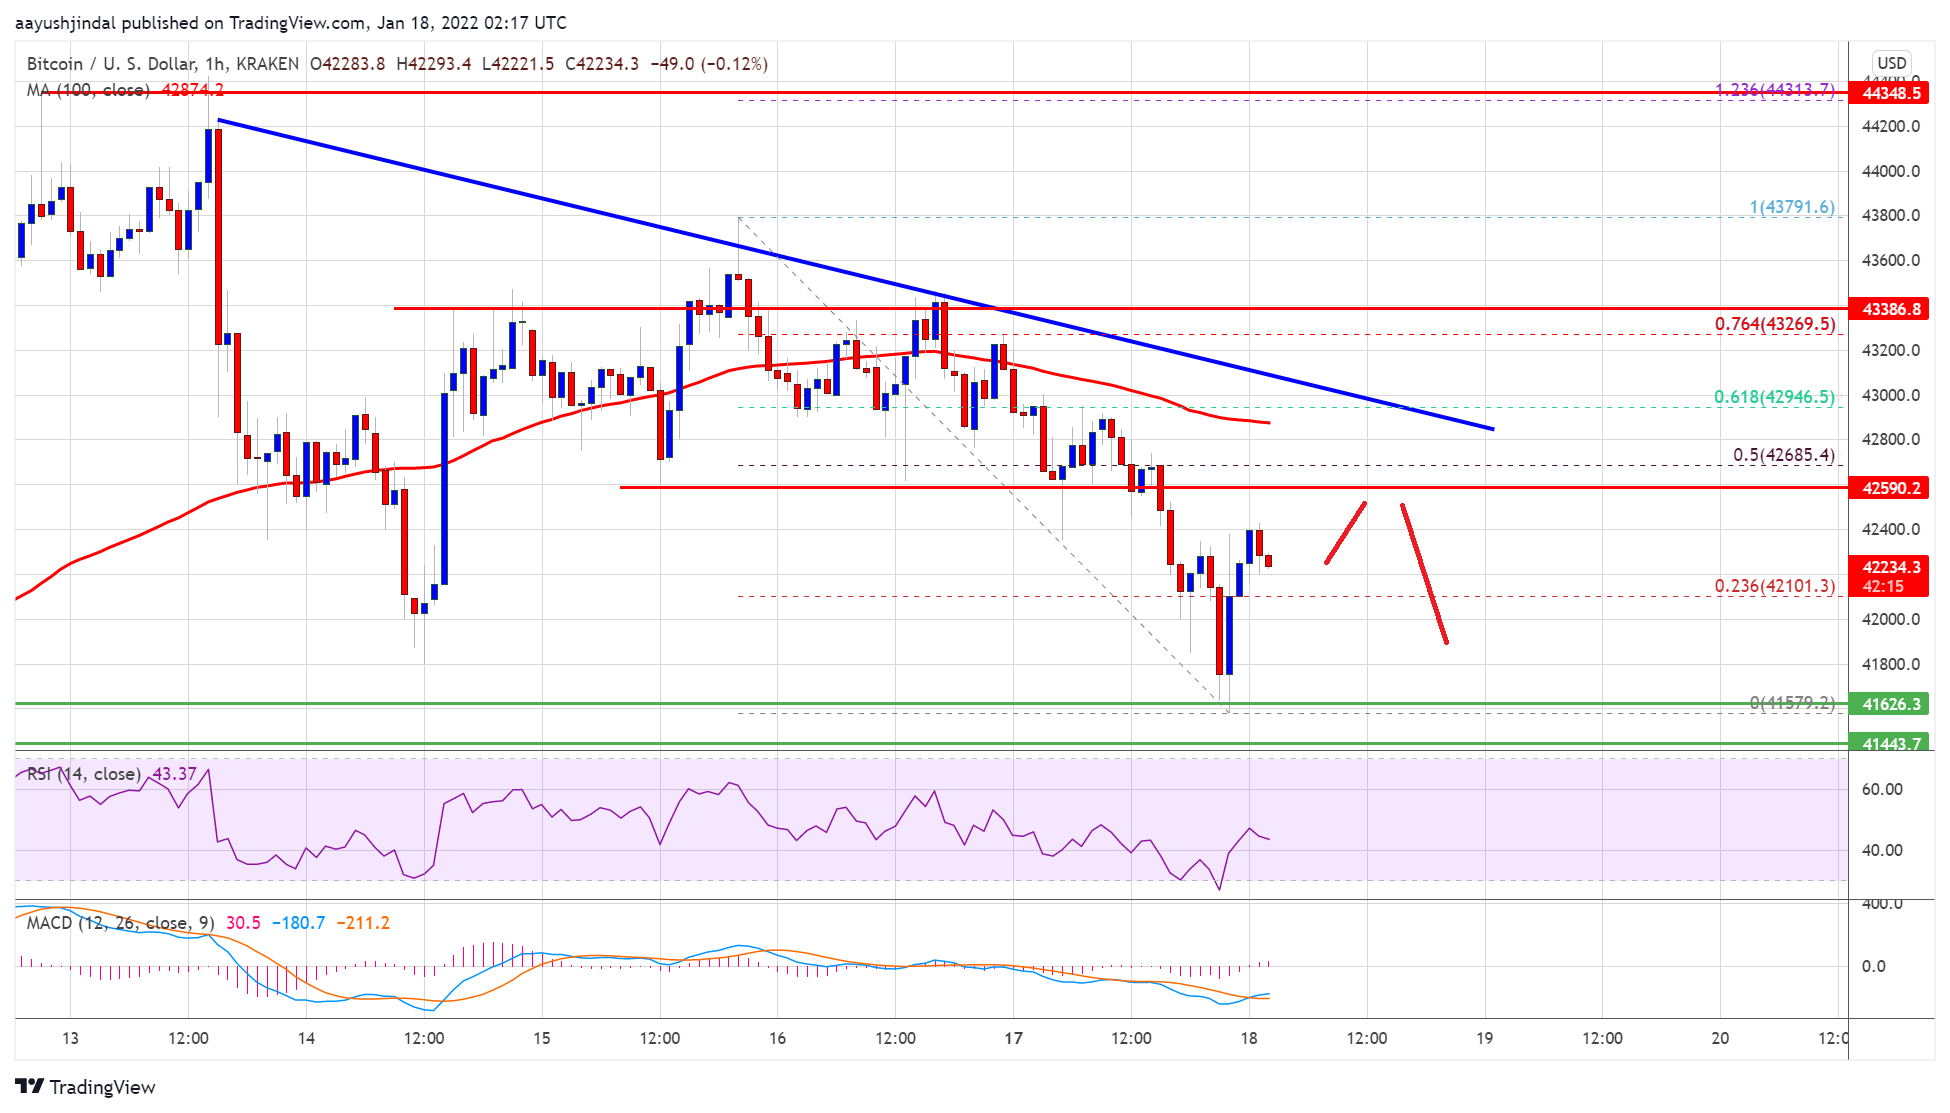
The price traded below the $42,500 and $42,000 support levels. It even traded close to $41,500 and settled below the 100 hourly simple moving average. A low was formed near $41,579 before the price started an upside correction.
Bitcoin price was able to recover above the $42,000 resistance zone. There was a break above the 23.6% Fib retracement level of the recent decline from the $43,800 swing high to $41,579 low.
On the upside, an initial resistance is near the $42,500 level. The next major resistance is near the $42,650 level. There is also a major bearish trend line forming with resistance near $42,800 on the hourly chart of the BTC/USD pair.
Source: BTCUSD on TradingView.com
The trend line is near the 50% retracement level of the recent decline from the $43,800 swing high to $41,579 low. A clear move above the $42,800 level might send the price towards the $43,500 resistance. Any more gains may perhaps call for a test of the $44,000 resistance zone. The next major resistance is near the $45,000 level.
More Losses in BTC?
If bitcoin fails to start a fresh increase above $42,800, it could continue to move down. An immediate support on the downside is near the $42,000 zone.
The first major support is seen near the $41,500 zone. A downside break below the $41,500 support zone could increase the chances of more downsides. The next major support is near $40,000, below which the bears might take control.
Technical indicators:
Hourly MACD – The MACD is slowly gaining pace in the bullish zone.
Hourly RSI (Relative Strength Index) – The RSI for BTC/USD is below the 50 level.
Major Support Levels – $41,500, followed by $41,200.
Major Resistance Levels – $42,650, $42,800 and $43,500.
Bitcoin failed to stay above the $43,000 support against the US Dollar. BTC is trading in a bearish zone and could continue to move down below $41,200.
Bitcoin is struggling to climb above the $42,500 and $42,800 resistance levels.
The price is trading below $43,000 and the 100 hourly simple moving average.
There is a major bearish trend line forming with resistance near $42,800 on the hourly chart of the BTC/USD pair (data feed from Kraken).
The pair could start a major increase if there is a clear move above the $43,000 resistance.
Bitcoin price failed to accelerate higher above the $43,500 resistance zone. As a result, there was a bearish reaction below the $43,000 pivot level.
The price traded below the $42,500 and $42,000 support levels. It even traded close to $41,500 and settled below the 100 hourly simple moving average. A low was formed near $41,579 before the price started an upside correction.
Bitcoin price was able to recover above the $42,000 resistance zone. There was a break above the 23.6% Fib retracement level of the recent decline from the $43,800 swing high to $41,579 low.
On the upside, an initial resistance is near the $42,500 level. The next major resistance is near the $42,650 level. There is also a major bearish trend line forming with resistance near $42,800 on the hourly chart of the BTC/USD pair.
Source: BTCUSD on TradingView.com
The trend line is near the 50% retracement level of the recent decline from the $43,800 swing high to $41,579 low. A clear move above the $42,800 level might send the price towards the $43,500 resistance. Any more gains may perhaps call for a test of the $44,000 resistance zone. The next major resistance is near the $45,000 level.
If bitcoin fails to start a fresh increase above $42,800, it could continue to move down. An immediate support on the downside is near the $42,000 zone.
The first major support is seen near the $41,500 zone. A downside break below the $41,500 support zone could increase the chances of more downsides. The next major support is near $40,000, below which the bears might take control.
Technical indicators:
Hourly MACD – The MACD is slowly gaining pace in the bullish zone.
Hourly RSI (Relative Strength Index) – The RSI for BTC/USD is below the 50 level.
Major Support Levels – $41,500, followed by $41,200.
Major Resistance Levels – $42,650, $42,800 and $43,500.
Tags: bitcoinbtcusdBTCUSDTxbtusd
FeedzyRead More
BTC holds near $70,000 and outperforms major assets during Middle East tensions, even as derivatives…
Two Prime CEO Alexander Blume says the high yield product driving the buying surge carries…
Your day-ahead look for March 12, 2026Read MoreCoinDesk: Bitcoin, Ethereum, Crypto News and Price Data[#item_full_content]
The futures-to-spot ratio has climbed to 5.1, reflecting a structural shift in how the market…
Bitcoin traded around $69,800 as open interest rose to $102 billion, suggesting defensive, bearish bets…
Bitcoin (BTC) is currently navigating a trading range between $60,000 and $73,000, entering what analytics…