Bitcoin extended decline below the $42,000 level against the US Dollar. BTC remains at a risk of more downsides if it stays below the $43,000 pivot zone.
Bitcoin extended decline and traded below the key $42,000 support zone.
The price is trading below $43,000 and the 100 hourly simple moving average.
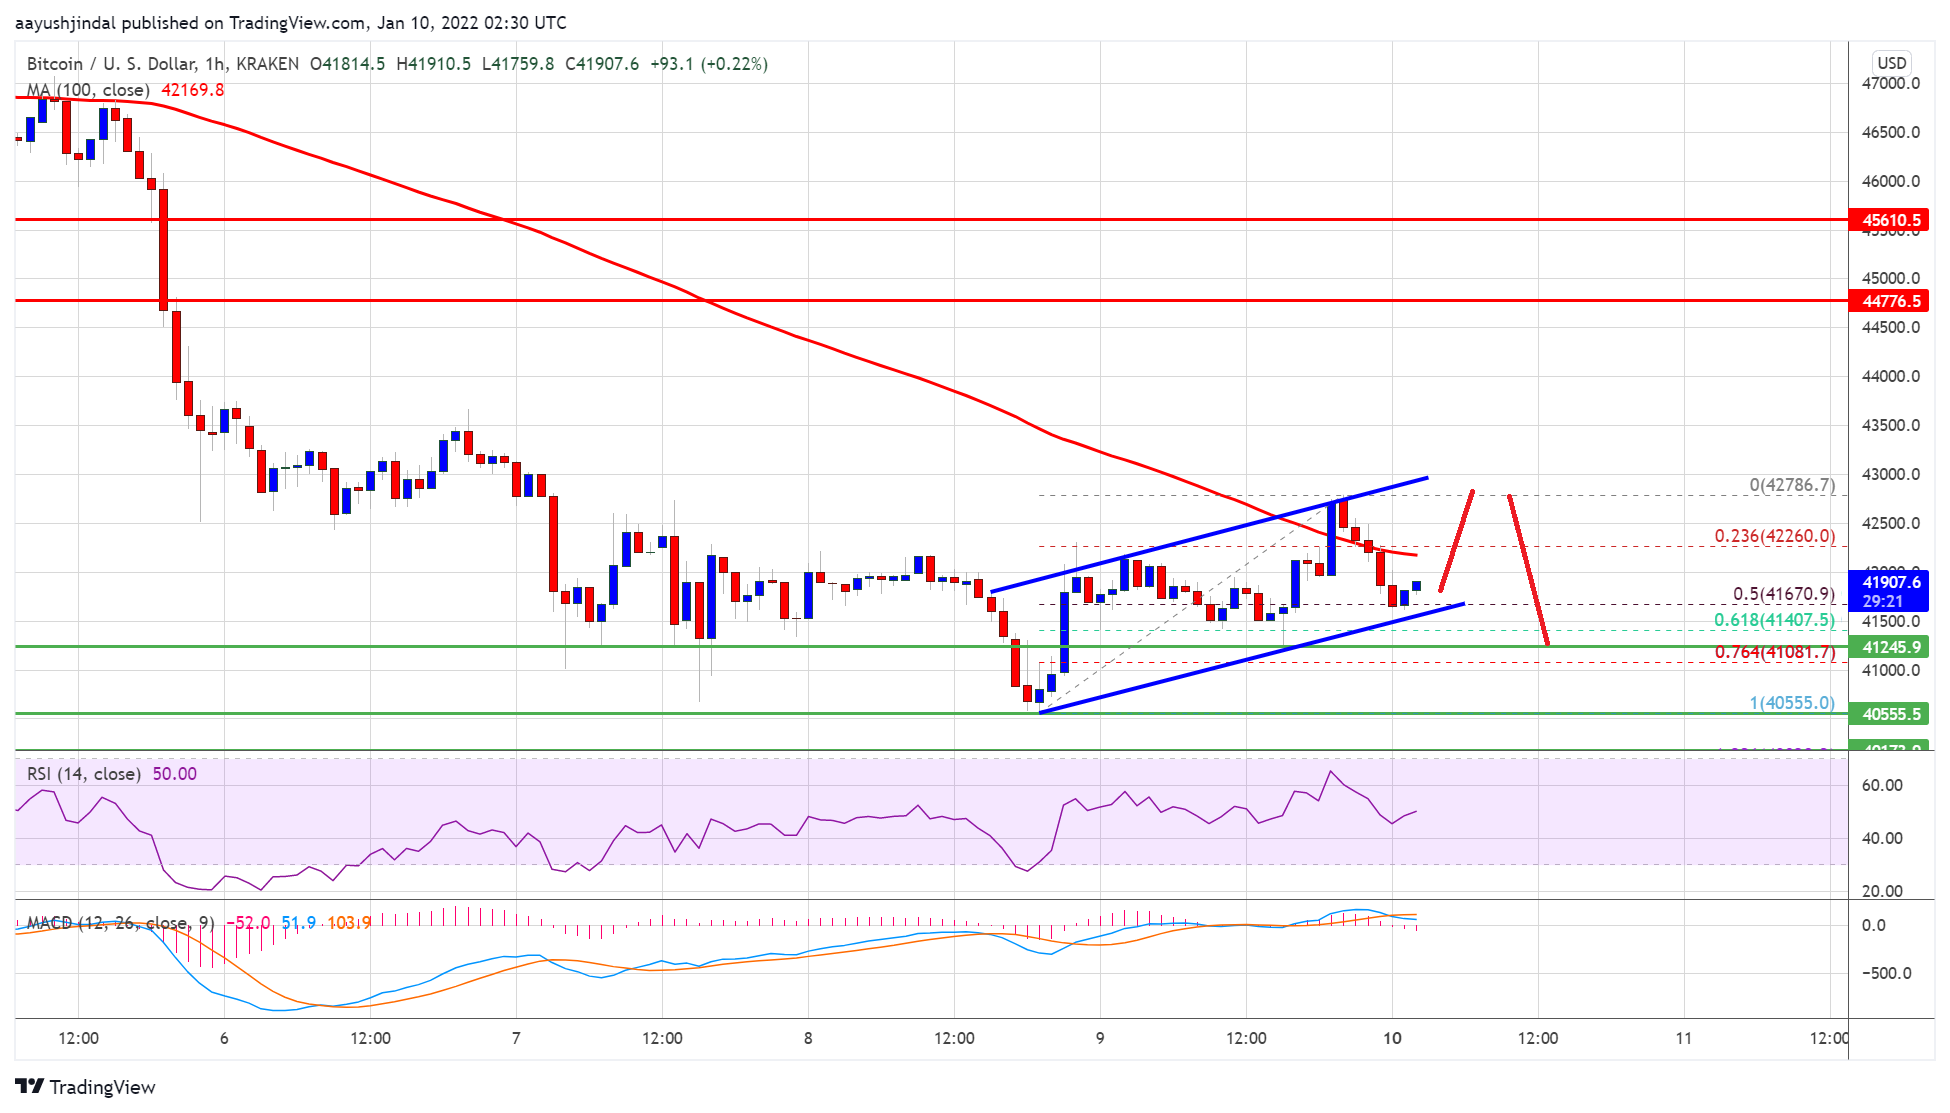
There is a key rising channel forming with support near $41,650 on the hourly chart of the BTC/USD pair (data feed from Kraken).
The pair might continue to move down if there is no recovery wave above $43,000.
Bitcoin Price Extends Decline
Bitcoin price started a major decline below the $45,000 and $43,500 support levels. BTC even declined below the $42,000 support zone to move further into a bearish zone.
The price settled below the $43,000 level and the 100 hourly simple moving average. The bears attempted a push towards $40,000. A low was formed near $40,555 before there was a recovery wave. The price recovered above the $42,000 level and the 100 hourly simple moving average.
However, the bears remained active near the $42,800 zone. A high is formed near $42,786 and the price is now declining. There was a move below the 23.6% Fib retracement level of the recent wave from the $40,555 swing low to $42,786 high.
It is now trading near the $41,750 support. The 50% Fib retracement level of the recent wave from the $40,555 swing low to $42,786 high is also near $41,650.
Besides, there is a key rising channel forming with support near $41,650 on the hourly chart of the BTC/USD pair. On the upside, the first major resistance is near the $42,250 level and the 100 hourly SMA. The next major resistance is near the $43,000 level.
Source: BTCUSD on TradingView.com
A clear move above the $43,000 resistance zone could start a decent recovery wave. The next major resistance is near the $44,500 level.
More Downsides in BTC?
If bitcoin fails to recover above $43,000, it could continue to move down. An immediate support is near the $41,800 zone. The first major support is near $41,650 and the channel trend line.
A downside break below the trend line support could spark a move below $41,000. In the stated case, the price may possibly decline towards the $40,000 level in the near term.
Technical indicators:
Hourly MACD – The MACD is now gaining pace in the bearish zone.
Hourly RSI (Relative Strength Index) – The RSI for BTC/USD is now near the 50 level.
Major Support Levels – $41,650, followed by $40,000.
Major Resistance Levels – $42,750, $43,000 and $44,500.
Bitcoin extended decline below the $42,000 level against the US Dollar. BTC remains at a risk of more downsides if it stays below the $43,000 pivot zone.
Bitcoin extended decline and traded below the key $42,000 support zone.
The price is trading below $43,000 and the 100 hourly simple moving average.
There is a key rising channel forming with support near $41,650 on the hourly chart of the BTC/USD pair (data feed from Kraken).
The pair might continue to move down if there is no recovery wave above $43,000.
Bitcoin price started a major decline below the $45,000 and $43,500 support levels. BTC even declined below the $42,000 support zone to move further into a bearish zone.
The price settled below the $43,000 level and the 100 hourly simple moving average. The bears attempted a push towards $40,000. A low was formed near $40,555 before there was a recovery wave. The price recovered above the $42,000 level and the 100 hourly simple moving average.
However, the bears remained active near the $42,800 zone. A high is formed near $42,786 and the price is now declining. There was a move below the 23.6% Fib retracement level of the recent wave from the $40,555 swing low to $42,786 high.
It is now trading near the $41,750 support. The 50% Fib retracement level of the recent wave from the $40,555 swing low to $42,786 high is also near $41,650.
Besides, there is a key rising channel forming with support near $41,650 on the hourly chart of the BTC/USD pair. On the upside, the first major resistance is near the $42,250 level and the 100 hourly SMA. The next major resistance is near the $43,000 level.
Source: BTCUSD on TradingView.com
A clear move above the $43,000 resistance zone could start a decent recovery wave. The next major resistance is near the $44,500 level.
If bitcoin fails to recover above $43,000, it could continue to move down. An immediate support is near the $41,800 zone. The first major support is near $41,650 and the channel trend line.
A downside break below the trend line support could spark a move below $41,000. In the stated case, the price may possibly decline towards the $40,000 level in the near term.
Technical indicators:
Hourly MACD – The MACD is now gaining pace in the bearish zone.
Hourly RSI (Relative Strength Index) – The RSI for BTC/USD is now near the 50 level.
Major Support Levels – $41,650, followed by $40,000.
Major Resistance Levels – $42,750, $43,000 and $44,500.
Tags: bitcoinbtcusdBTCUSDTxbtusd
FeedzyRead More
SATS will offer a fixed 15% dividend yield at par and be junior to the…
Bitcoin Magazine Researchers Build First Working Post-Quantum Defense for Bitcoin’s Lightning Network Whether or not…
Bitcoin Magazine The Amount of Bitcoin on Exchanges Is Shrinking. Is a Rally Imminent? Bitcoin’s…
Bitcoin Magazine Strive Buys More Bitcoin, Crosses 30,000 BTC Mark Nasdaq-listed Strive isn’t slowing down…
Bitcoin Magazine Matt Dines: Why a Rising Dollar is Bullish for Bitcoin The dollar is…
Bitcoin Magazine Alex Gladstein: How The Bitcoin-AI Convergence Impacts the Fight for Freedom Is the…