Bitcoin is struggling below the $20,000 zone against the US Dollar. BTC remains at a risk of more losses if the bulls fail to protect the $19,800 support zone.
Bitcoin is showing bearish signs below the $21,000 and $20,500 levels.
The price is now trading below the $20,400 level and the 100 hourly simple moving average.
There is a key bearish trend line forming with resistance near $20,400 on the hourly chart of the BTC/USD pair (data feed from Kraken).
The pair could decline further if there is a clear move below the $19,800 zone.
Bitcoin Price Remains At Risk
Bitcoin price failed to recover above the $21,000 pivot level. The price remained in a bearish zone and extended its decline below the $20,500 support zone.
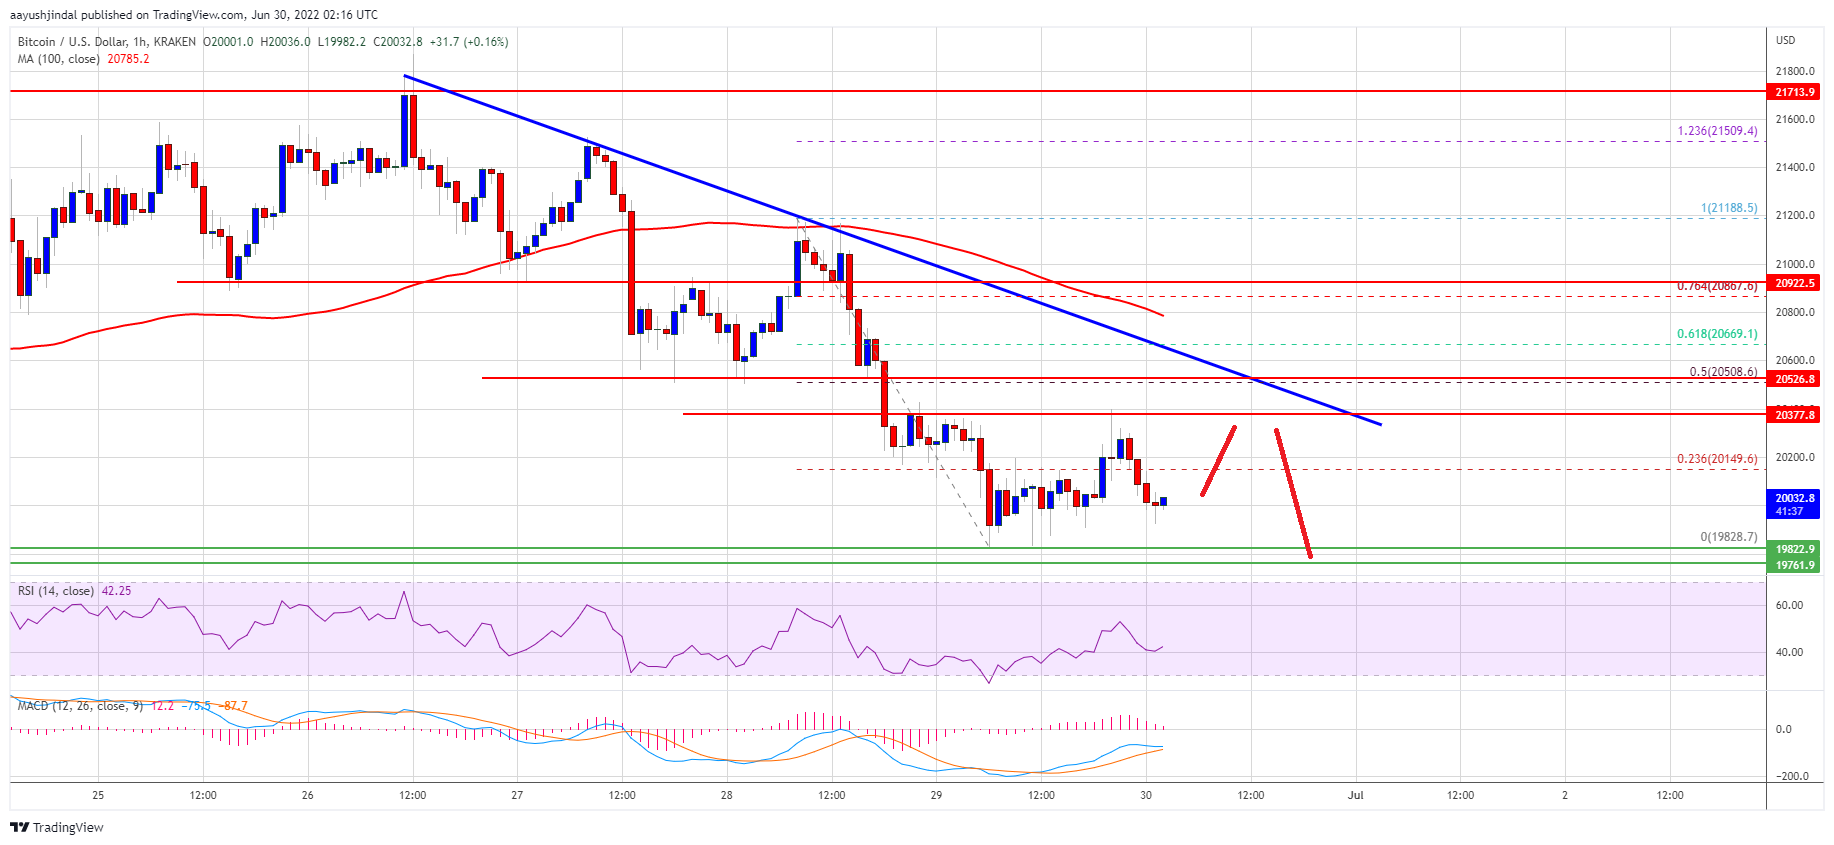
There was also a close below the $20,250 level. BTC spiked below the $20,000 level, but the bulls were active near $19,800 level. A low is formed near $19,828 and the price is now consolidating losses. It is now trading below the $20,400 level and the 100 hourly simple moving average.
An immediate resistance on the upside is near the $20,150 level. It is near the 23.6% Fib retracement level of the recent decline from the $21,188 swing high to $19,828 low.
The next key resistance is near the $20,400 zone. There is also a key bearish trend line forming with resistance near $20,400 on the hourly chart of the BTC/USD pair. The trend line is near the 50% Fib retracement level of the recent decline from the $21,188 swing high to $19,828 low.
Source: BTCUSD on TradingView.com
A clear move above the trend line resistance and then $20,500 could start a recovery wave. In the stated case, the price could rise towards the $20,900 level. The next major hurdle for the bulls might be near the $21,200 zone, above which the price may perhaps rise towards the $21,800 level.
More Losses in BTC?
If bitcoin fails to clear the $20,500 resistance zone, it could continue to move down. An immediate support on the downside is near the $20,000 level.
The main support now sits near the $19,800 level, below which the price could accelerate lower. The next major support sits near the $18,800 zone. Any more losses could send the price towards the $18,000 level.
Technical indicators:
Hourly MACD – The MACD is now losing pace in the bearish zone.
Hourly RSI (Relative Strength Index) – The RSI for BTC/USD is now below the 50 level.
Major Support Levels – $20,000, followed by $19,800.
Major Resistance Levels – $20,150, $20,400 and $20,500.
Bitcoin is struggling below the $20,000 zone against the US Dollar. BTC remains at a risk of more losses if the bulls fail to protect the $19,800 support zone.
Bitcoin is showing bearish signs below the $21,000 and $20,500 levels.
The price is now trading below the $20,400 level and the 100 hourly simple moving average.
There is a key bearish trend line forming with resistance near $20,400 on the hourly chart of the BTC/USD pair (data feed from Kraken).
The pair could decline further if there is a clear move below the $19,800 zone.
Bitcoin price failed to recover above the $21,000 pivot level. The price remained in a bearish zone and extended its decline below the $20,500 support zone.
There was also a close below the $20,250 level. BTC spiked below the $20,000 level, but the bulls were active near $19,800 level. A low is formed near $19,828 and the price is now consolidating losses. It is now trading below the $20,400 level and the 100 hourly simple moving average.
An immediate resistance on the upside is near the $20,150 level. It is near the 23.6% Fib retracement level of the recent decline from the $21,188 swing high to $19,828 low.
The next key resistance is near the $20,400 zone. There is also a key bearish trend line forming with resistance near $20,400 on the hourly chart of the BTC/USD pair. The trend line is near the 50% Fib retracement level of the recent decline from the $21,188 swing high to $19,828 low.
Source: BTCUSD on TradingView.com
A clear move above the trend line resistance and then $20,500 could start a recovery wave. In the stated case, the price could rise towards the $20,900 level. The next major hurdle for the bulls might be near the $21,200 zone, above which the price may perhaps rise towards the $21,800 level.
If bitcoin fails to clear the $20,500 resistance zone, it could continue to move down. An immediate support on the downside is near the $20,000 level.
The main support now sits near the $19,800 level, below which the price could accelerate lower. The next major support sits near the $18,800 zone. Any more losses could send the price towards the $18,000 level.
Technical indicators:
Hourly MACD – The MACD is now losing pace in the bearish zone.
Hourly RSI (Relative Strength Index) – The RSI for BTC/USD is now below the 50 level.
Major Support Levels – $20,000, followed by $19,800.
Major Resistance Levels – $20,150, $20,400 and $20,500.
Tags: bitcoinbtcusdBTCUSDTxbtusd
FeedzyRead More
Capriole Investments founder Charles Edwards says Bitcoin has moved into a historically attractive accumulation area,…
BTC climbed 2% to break through $72,000 while U.S. equity futures slipped and the dollar…
Your day-ahead look for March 13, 2026Read MoreCoinDesk: Bitcoin, Ethereum, Crypto News and Price Data[#item_full_content]
Stronger dollar, rising Treasury yields, and tech equities treading water contrast with bitcoin’s resilience amid…
Despite trading more than 40% below its all-time high, with $70,000 serving as a short-term…
On-chain analytics firm Santiment has highlighted how the average Bitcoin returns of the buyers from…