Bitcoin is still well below the $48,000 resistance against the US Dollar. BTC remains at a risk of a sharp decline if it fails to stay above the $45,500 support zone.
Bitcoin is trading in a bearish zone below the $48,000 resistance level.
The price is trading below $47,000 and the 100 hourly simple moving average.
There is a major bearish trend line forming with resistance near $47,000 on the hourly chart of the BTC/USD pair (data feed from Kraken).
The pair might start a strong recovery wave if it stays above the $45,500 support zone.
Bitcoin Price Eyes Recovery
Bitcoin price attempted a fresh increase above the $47,000 level. However, BTC failed to clear the $47,500 level and started a fresh decline.
There was a clear move below the $47,200 and $47,000 levels. The price even dived below the $46,000 support zone. Finally, the bulls defended the main $45,500 support zone. A low is formed near $45,548 and the price is now consolidating losses.
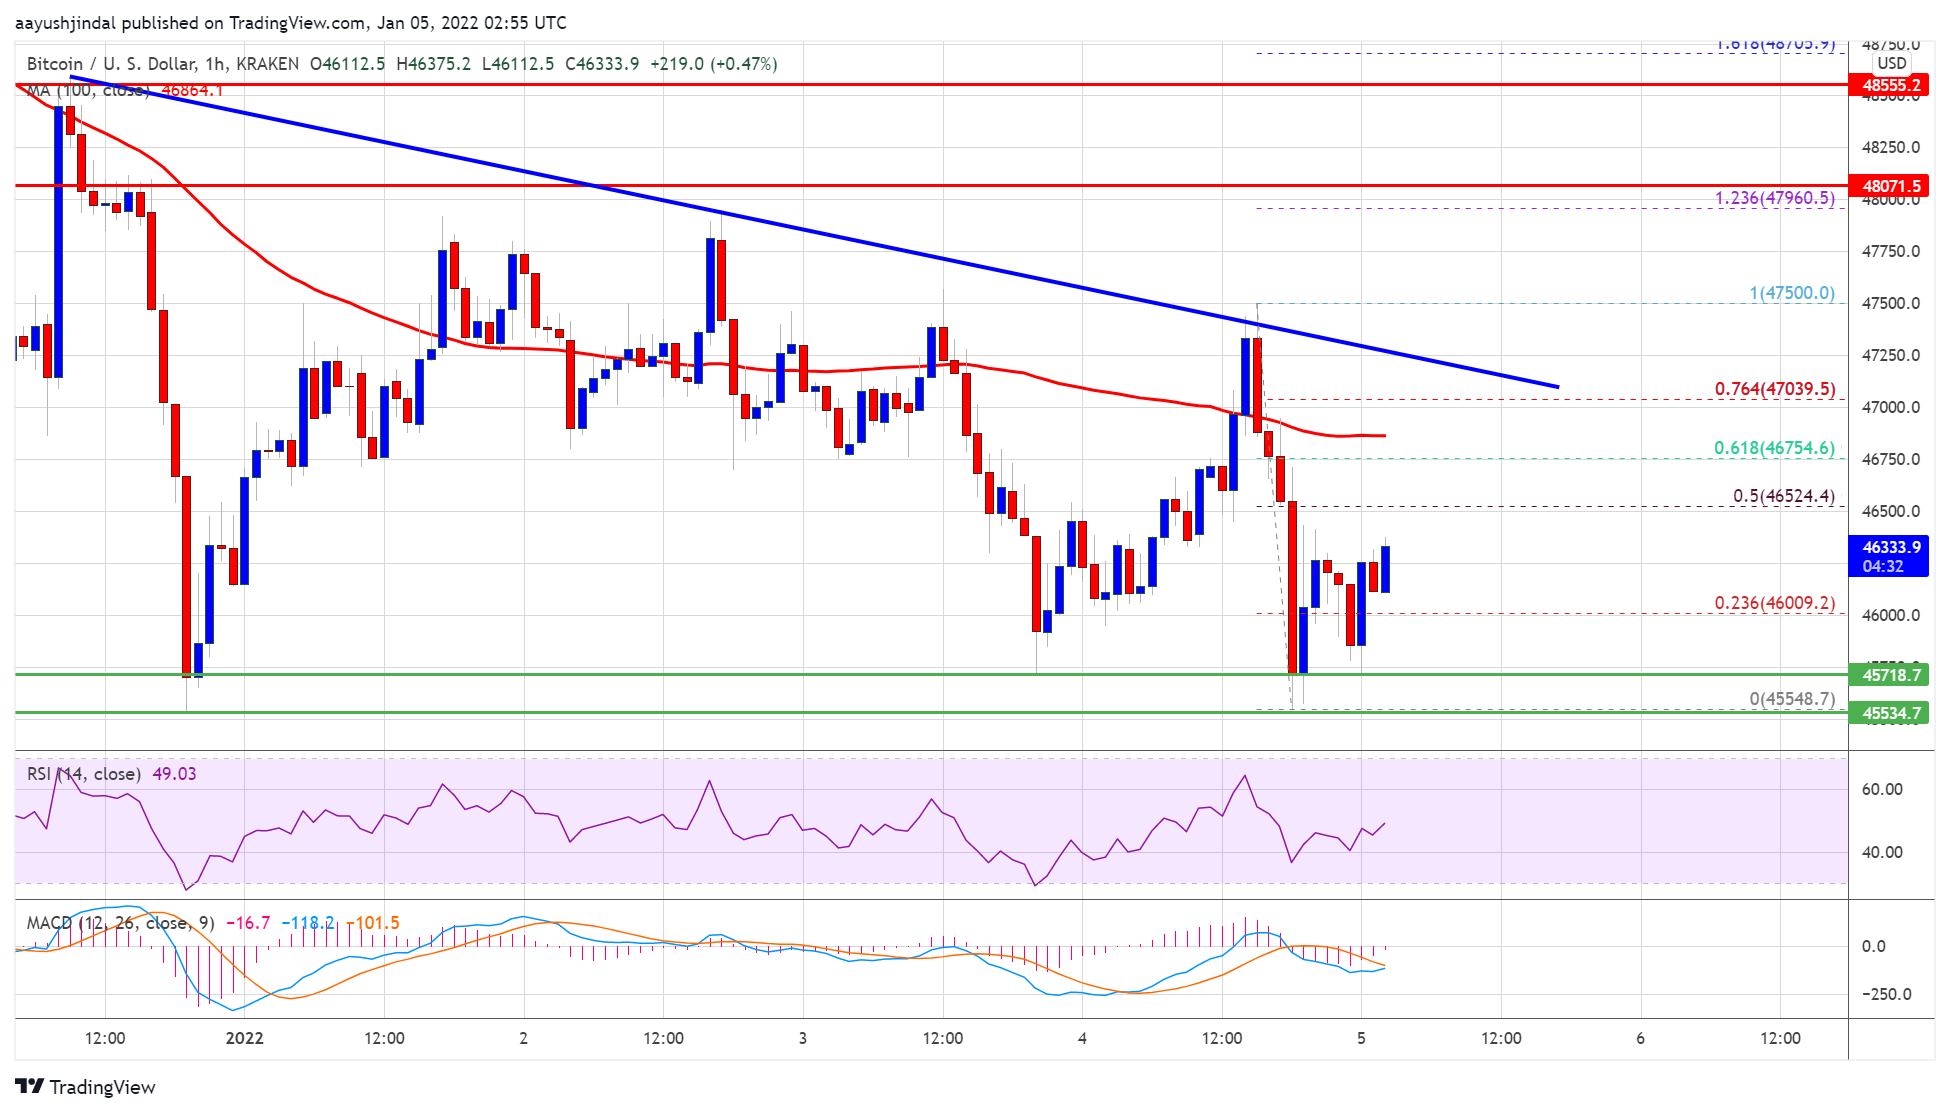
Bitcoin is trading below $47,000 and the 100 hourly simple moving average. It recovered a few points above the 23.6% Fib retracement level of the recent drop from the $47,500 swing high to $45,548 low.
An initial resistance is near the $46,500 level. It is near the 50% Fib retracement level of the recent drop from the $47,500 swing high to $45,548 low. The first major resistance on the upside is near the $47,000 level. There is also a major bearish trend line forming with resistance near $47,000 on the hourly chart of the BTC/USD pair.
Source: BTCUSD on TradingView.com
A clear move above the $47,000 resistance zone and the trend line could start a strong recovery. The next major resistance is near the $48,000 level.
More Losses In BTC?
If bitcoin fails to recover above $46,500, it could continue to move down. An immediate support is near the $46,000 zone. The first major support is near $45,500.
A downside break below the $45,500 level could push the price further lower. In the stated case, the price may possibly decline towards the $43,000 level in the coming sessions.
Technical indicators:
Hourly MACD – The MACD is now losing pace in the bearish zone.
Hourly RSI (Relative Strength Index) – The RSI for BTC/USD is near the 50 level.
Major Support Levels – $46,000, followed by $45,500.
Major Resistance Levels – $46,500, $47,000 and $47,500.
Bitcoin is still well below the $48,000 resistance against the US Dollar. BTC remains at a risk of a sharp decline if it fails to stay above the $45,500 support zone.
Bitcoin is trading in a bearish zone below the $48,000 resistance level.
The price is trading below $47,000 and the 100 hourly simple moving average.
There is a major bearish trend line forming with resistance near $47,000 on the hourly chart of the BTC/USD pair (data feed from Kraken).
The pair might start a strong recovery wave if it stays above the $45,500 support zone.
Bitcoin price attempted a fresh increase above the $47,000 level. However, BTC failed to clear the $47,500 level and started a fresh decline.
There was a clear move below the $47,200 and $47,000 levels. The price even dived below the $46,000 support zone. Finally, the bulls defended the main $45,500 support zone. A low is formed near $45,548 and the price is now consolidating losses.
Bitcoin is trading below $47,000 and the 100 hourly simple moving average. It recovered a few points above the 23.6% Fib retracement level of the recent drop from the $47,500 swing high to $45,548 low.
An initial resistance is near the $46,500 level. It is near the 50% Fib retracement level of the recent drop from the $47,500 swing high to $45,548 low. The first major resistance on the upside is near the $47,000 level. There is also a major bearish trend line forming with resistance near $47,000 on the hourly chart of the BTC/USD pair.
Source: BTCUSD on TradingView.com
A clear move above the $47,000 resistance zone and the trend line could start a strong recovery. The next major resistance is near the $48,000 level.
If bitcoin fails to recover above $46,500, it could continue to move down. An immediate support is near the $46,000 zone. The first major support is near $45,500.
A downside break below the $45,500 level could push the price further lower. In the stated case, the price may possibly decline towards the $43,000 level in the coming sessions.
Technical indicators:
Hourly MACD – The MACD is now losing pace in the bearish zone.
Hourly RSI (Relative Strength Index) – The RSI for BTC/USD is near the 50 level.
Major Support Levels – $46,000, followed by $45,500.
Major Resistance Levels – $46,500, $47,000 and $47,500.
Tags: bitcoinbtcusdBTCUSDTxbtusd
FeedzyRead More
A recent report from BitcoinTreasuries.Net highlights significant challenges faced by Bitcoin-focused treasury companies since November.…
Bitcoin price stayed above the $90,000 support zone. BTC is now rising and might soon…
Bitcoin has retraced below the $91,000 level following the Federal Reserve’s decision to cut interest…
Downward pressure on bitcoin is losing steam, with the market stabilizing but not yet out…
Bitcoin is trading in a world where headlines still scream “bull” or “bear” while the…
Crypto analyst Javon Marks has provided a bullish outlook for the XRP price, predicting that…