Bitcoin started a fresh increase from the $45,500 zone against the US Dollar. BTC is rising and there could be a strong move above the $50,000 resistance.
Bitcoin started a fresh increase above the $48,500 resistance zone.
The price is now trading above $48,000 and the 100 hourly simple moving average.
There is a key rising channel forming with support near $48,750 on the hourly chart of the BTC/USD pair (data feed from Kraken).
The pair could accelerate further higher above the $50,000 resistance.
Bitcoin Price Extends Recovery
Bitcoin price formed a base and started a fresh increase above the $46,500 level. BTC gained pace for a move above the $47,500 level and the 100 hourly simple moving average.
The upward move was such that the price broke the $48,500 resistance. There was a clear move above the 76.4% Fib retracement level of the key decline from the $48,289 swing high to $45,600 low. The bulls even pushed the price above the $49,000 level.
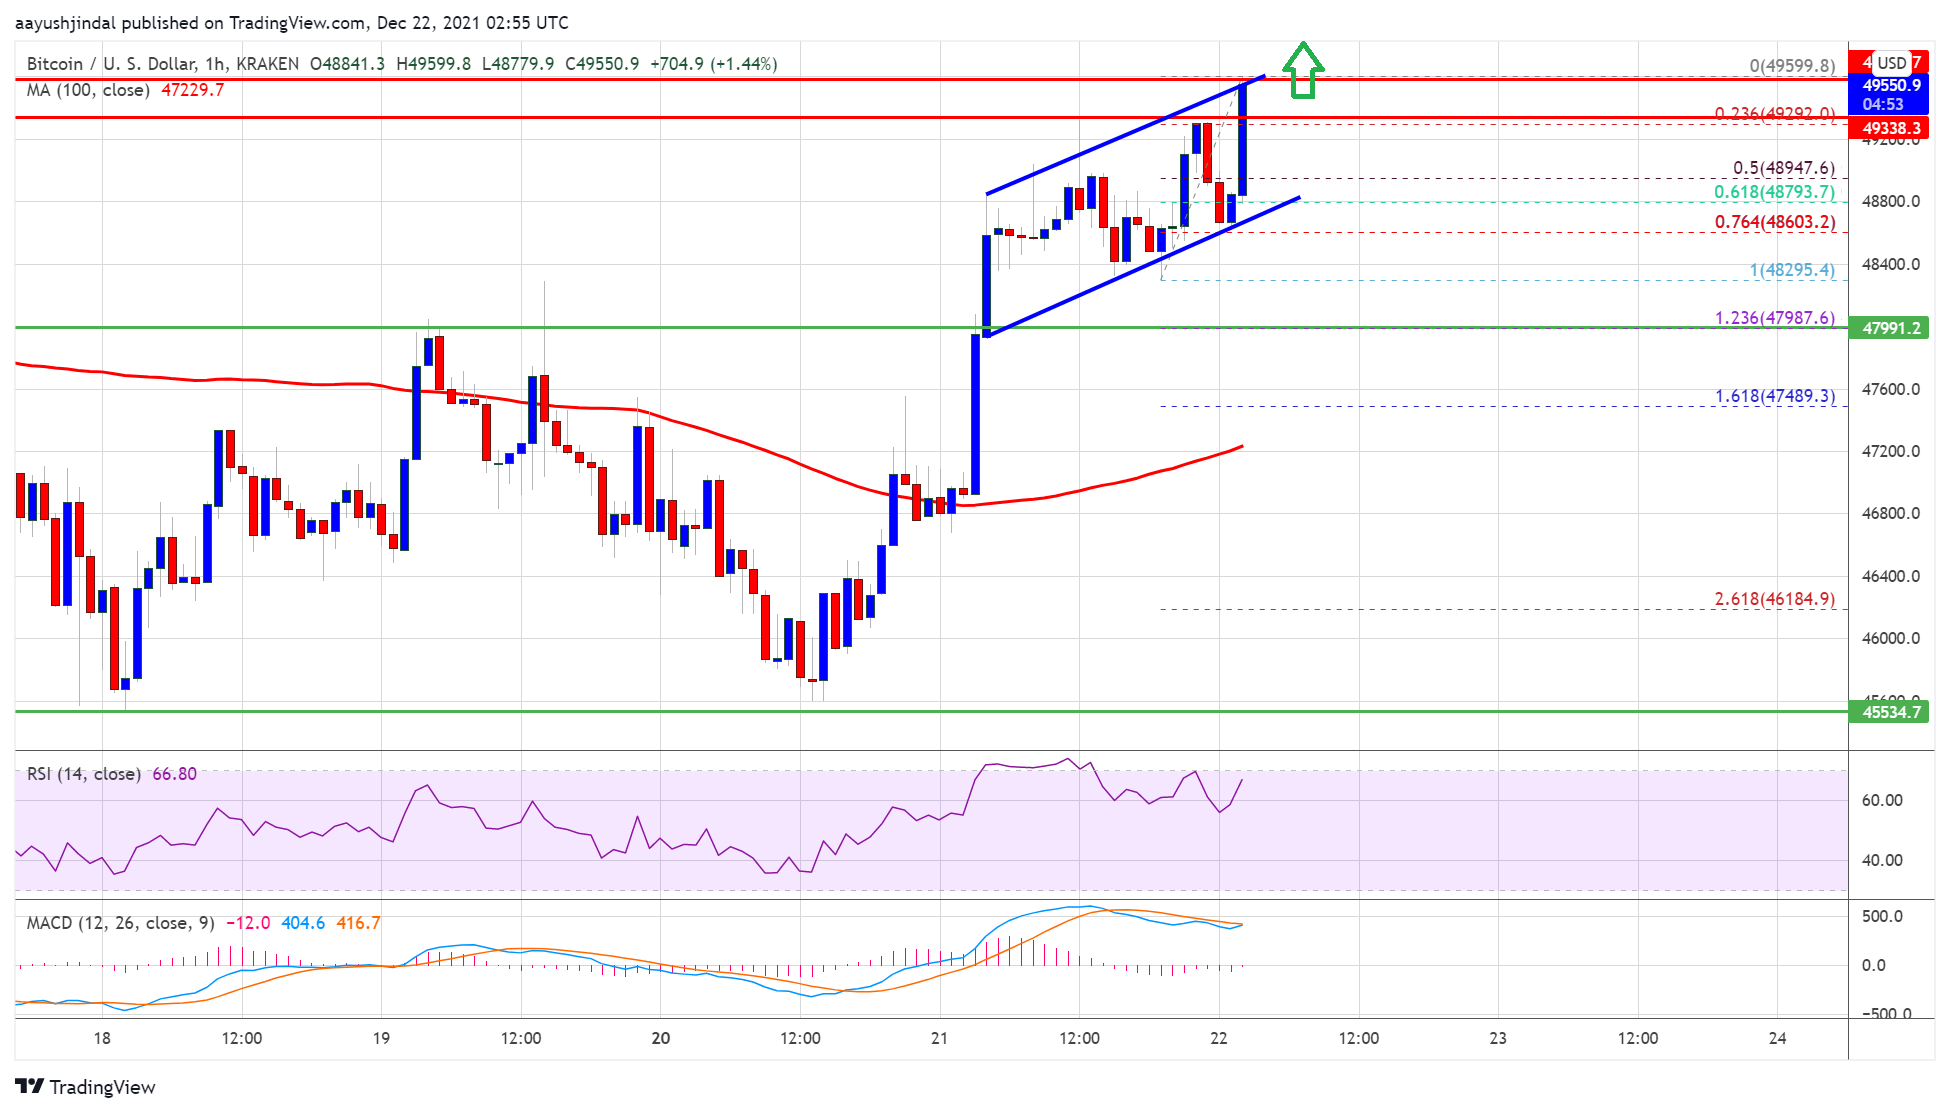
A high is formed near $49,600 and the price is now showing a lot of positive signs. There is also a key rising channel forming with support near $48,750 on the hourly chart of the BTC/USD pair.
Source: BTCUSD on TradingView.com
Bitcoin is trading well above the 23.6% Fib retracement level of the upward move from the $48,295 swing low to $49,600 high. It is facing resistance near the $49,600 zone. The next key resistance could be $50,000. A clear move above the $50,000 resistance zone could set the pace for a larger increase. The next major stop for the bulls may possibly be near the $51,200 level.
Dips Limited In BTC?
If bitcoin fails to clear the $50,000 resistance zone, it could start a fresh downside correction. An immediate support on the downside is near the $49,200 level.
The first major support is near $49,000. It is near the 50% Fib retracement level of the upward move from the $48,295 swing low to $49,600 high. A downside break below the $49,000 level could push the price towards the $48,500 support, below which the price could test $48,800.
Technical indicators:
Hourly MACD – The MACD is slowly gaining pace in the bullish zone.
Hourly RSI (Relative Strength Index) – The RSI for BTC/USD is currently well above the 50 level.
Major Support Levels – $49,000, followed by $48,500.
Major Resistance Levels – $49,600, $50,000 and $51,200.
Bitcoin started a fresh increase from the $45,500 zone against the US Dollar. BTC is rising and there could be a strong move above the $50,000 resistance.
Bitcoin started a fresh increase above the $48,500 resistance zone.
The price is now trading above $48,000 and the 100 hourly simple moving average.
There is a key rising channel forming with support near $48,750 on the hourly chart of the BTC/USD pair (data feed from Kraken).
The pair could accelerate further higher above the $50,000 resistance.
Bitcoin price formed a base and started a fresh increase above the $46,500 level. BTC gained pace for a move above the $47,500 level and the 100 hourly simple moving average.
The upward move was such that the price broke the $48,500 resistance. There was a clear move above the 76.4% Fib retracement level of the key decline from the $48,289 swing high to $45,600 low. The bulls even pushed the price above the $49,000 level.
A high is formed near $49,600 and the price is now showing a lot of positive signs. There is also a key rising channel forming with support near $48,750 on the hourly chart of the BTC/USD pair.
Source: BTCUSD on TradingView.com
Bitcoin is trading well above the 23.6% Fib retracement level of the upward move from the $48,295 swing low to $49,600 high. It is facing resistance near the $49,600 zone. The next key resistance could be $50,000. A clear move above the $50,000 resistance zone could set the pace for a larger increase. The next major stop for the bulls may possibly be near the $51,200 level.
If bitcoin fails to clear the $50,000 resistance zone, it could start a fresh downside correction. An immediate support on the downside is near the $49,200 level.
The first major support is near $49,000. It is near the 50% Fib retracement level of the upward move from the $48,295 swing low to $49,600 high. A downside break below the $49,000 level could push the price towards the $48,500 support, below which the price could test $48,800.
Technical indicators:
Hourly MACD – The MACD is slowly gaining pace in the bullish zone.
Hourly RSI (Relative Strength Index) – The RSI for BTC/USD is currently well above the 50 level.
Major Support Levels – $49,000, followed by $48,500.
Major Resistance Levels – $49,600, $50,000 and $51,200.
Tags: bitcoinbtcusdBTCUSDTxbtusd
FeedzyRead More
Hougan says bitcoin could reach that milestone if it captures a larger share of the…
After another failed attempt at breaking the $74,000 resistance, the Bitcoin price continues to hover…
Prominent analyst Darkfost shares that Bitcoin remains a long time away from establishing a new…
Over the last day, Bitcoin prices have remained within the $70,000 – $72,000 region, recording…
Each escalation in the Iran conflict has been larger than the last, but each bitcoin…
The Bitcoin price has not particularly impressed over the past two weeks, but it appears…