Bitcoin remained well bid above the $29,350 support zone against the US Dollar. BTC started a fresh increase and cleared the $30,000 resistance zone.
Bitcoin started a recovery wave from the $29,350 support zone.
The price is now trading above the $30,000 level and the 100 hourly simple moving average.
There was a break above a major bearish trend line with resistance near $29,700 on the hourly chart of the BTC/USD pair (data feed from Kraken).
The pair could accelerate higher if it clears the $31,180 resistance zone.
Bitcoin Price Aims Higher
Bitcoin price remained well bid near the key $29,350 support zone. A base was formed near $29,350 and the price started a fresh increase. There was a clear move above the $29,800 and $30,000 resistance levels.
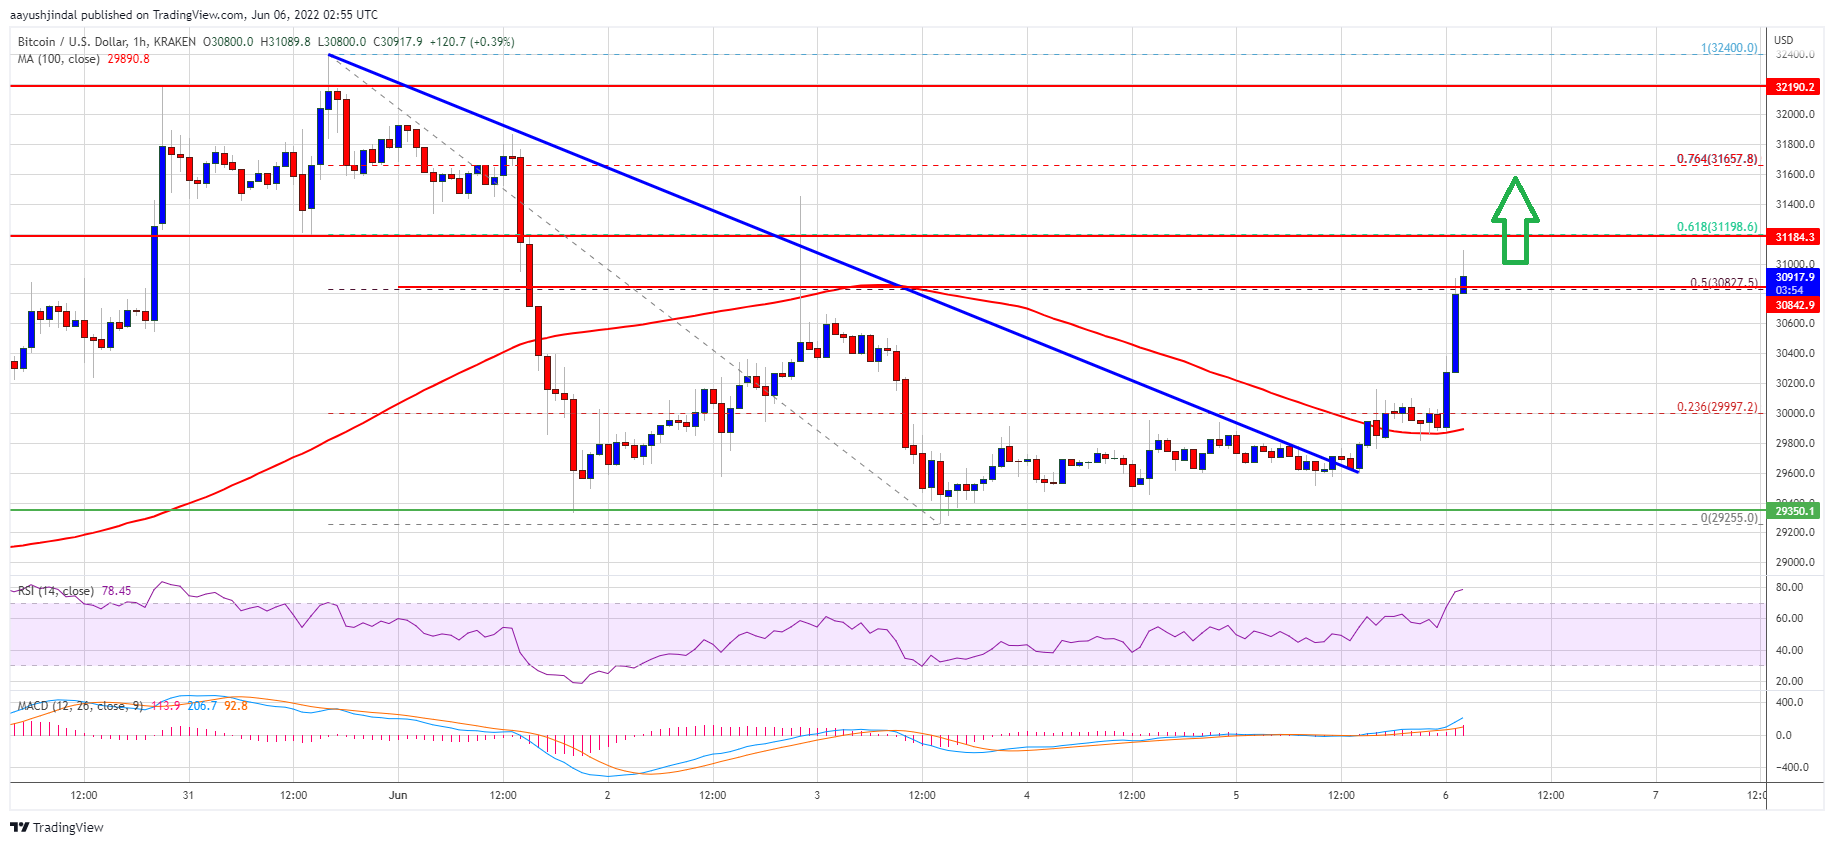
Besides, there was a break above a major bearish trend line with resistance near $29,700 on the hourly chart of the BTC/USD pair. The pair climbed above the $30,000 level and the 100 hourly simple moving average. There was a spike above the 50% Fib retracement level of the key decline from the $32,400 swing high to $29,255 low.
Bitcoin price is now consolidating near the $30,800 level. An immediate resistance on the upside is near the $31,180 level. It is near the 61.8% Fib retracement level of the key decline from the $32,400 swing high to $29,255 low.
Source: BTCUSD on TradingView.com
The next major resistance is near the $31,650 level. A clear move above the $31,650 resistance level could start another increase. In the stated case, the price could rise towards the $32,400 resistance. The next major resistance sits near the $33,000 level.
Dips Limited in BTC?
If bitcoin fails to clear the $31,180 resistance zone, it could a downside correction. An immediate support on the downside is near the $30,400 level.
The next major support is near the $29,950 level and the 100 hourly simple moving average. A downside break below the $29,950 support may perhaps spark another decline. In the stated case, the price could revisit the $29,350 support zone in the near term.
Technical indicators:
Hourly MACD – The MACD is now gaining pace in the bullish zone.
Hourly RSI (Relative Strength Index) – The RSI for BTC/USD is now well above the 50 level.
Major Support Levels – $30,400, followed by $29,950.
Major Resistance Levels – $31,180, $31,650 and $32,400.
Bitcoin remained well bid above the $29,350 support zone against the US Dollar. BTC started a fresh increase and cleared the $30,000 resistance zone.
Bitcoin started a recovery wave from the $29,350 support zone.
The price is now trading above the $30,000 level and the 100 hourly simple moving average.
There was a break above a major bearish trend line with resistance near $29,700 on the hourly chart of the BTC/USD pair (data feed from Kraken).
The pair could accelerate higher if it clears the $31,180 resistance zone.
Bitcoin price remained well bid near the key $29,350 support zone. A base was formed near $29,350 and the price started a fresh increase. There was a clear move above the $29,800 and $30,000 resistance levels.
Besides, there was a break above a major bearish trend line with resistance near $29,700 on the hourly chart of the BTC/USD pair. The pair climbed above the $30,000 level and the 100 hourly simple moving average. There was a spike above the 50% Fib retracement level of the key decline from the $32,400 swing high to $29,255 low.
Bitcoin price is now consolidating near the $30,800 level. An immediate resistance on the upside is near the $31,180 level. It is near the 61.8% Fib retracement level of the key decline from the $32,400 swing high to $29,255 low.
Source: BTCUSD on TradingView.com
The next major resistance is near the $31,650 level. A clear move above the $31,650 resistance level could start another increase. In the stated case, the price could rise towards the $32,400 resistance. The next major resistance sits near the $33,000 level.
If bitcoin fails to clear the $31,180 resistance zone, it could a downside correction. An immediate support on the downside is near the $30,400 level.
The next major support is near the $29,950 level and the 100 hourly simple moving average. A downside break below the $29,950 support may perhaps spark another decline. In the stated case, the price could revisit the $29,350 support zone in the near term.
Technical indicators:
Hourly MACD – The MACD is now gaining pace in the bullish zone.
Hourly RSI (Relative Strength Index) – The RSI for BTC/USD is now well above the 50 level.
Major Support Levels – $30,400, followed by $29,950.
Major Resistance Levels – $31,180, $31,650 and $32,400.
Tags: bitcoinbtcusdBTCUSDTxbtusd
FeedzyRead More
CryptoQuant’s 30-day apparent demand indicator is negative, signaling that buyers aren’t absorbing the available supply…
ASST climbs 133% in three months as Strive grows holdings to 16,500 BTC and explores…
Digital asset investment products shed $1.47 billion in a single week — the second consecutive…
Your day-ahead look for May 26, 2026Read MoreCoinDesk: Bitcoin, Ethereum, Crypto News and Price Data[#item_full_content]
The bitcoin price chart is forming a potential lower high while ether languishes in a…
Heavy supply concentration and large options positioning continue to suppress volatility and keep bitcoin range-bound.Read…