Bitcoin attempted a move towards $45,000 but failed against the US Dollar. BTC is correcting lower, but dips might be limited below $42,800.
Bitcoin extended increase above $44,000 before it faced sellers.
The price is trading above $43,500 and the 100 hourly simple moving average.
There was a break below a short-term rising channel with support near $44,200 on the hourly chart of the BTC/USD pair (data feed from Kraken).
The pair could drop to $43,000 or $42,800, where the bulls might take a stand.
Bitcoin Price Faces Resistance
Bitcoin price remained supported and extended increase above the $44,000 level. BTC even cleared the $44,500 resistance and settled above the 100 hourly simple moving average.
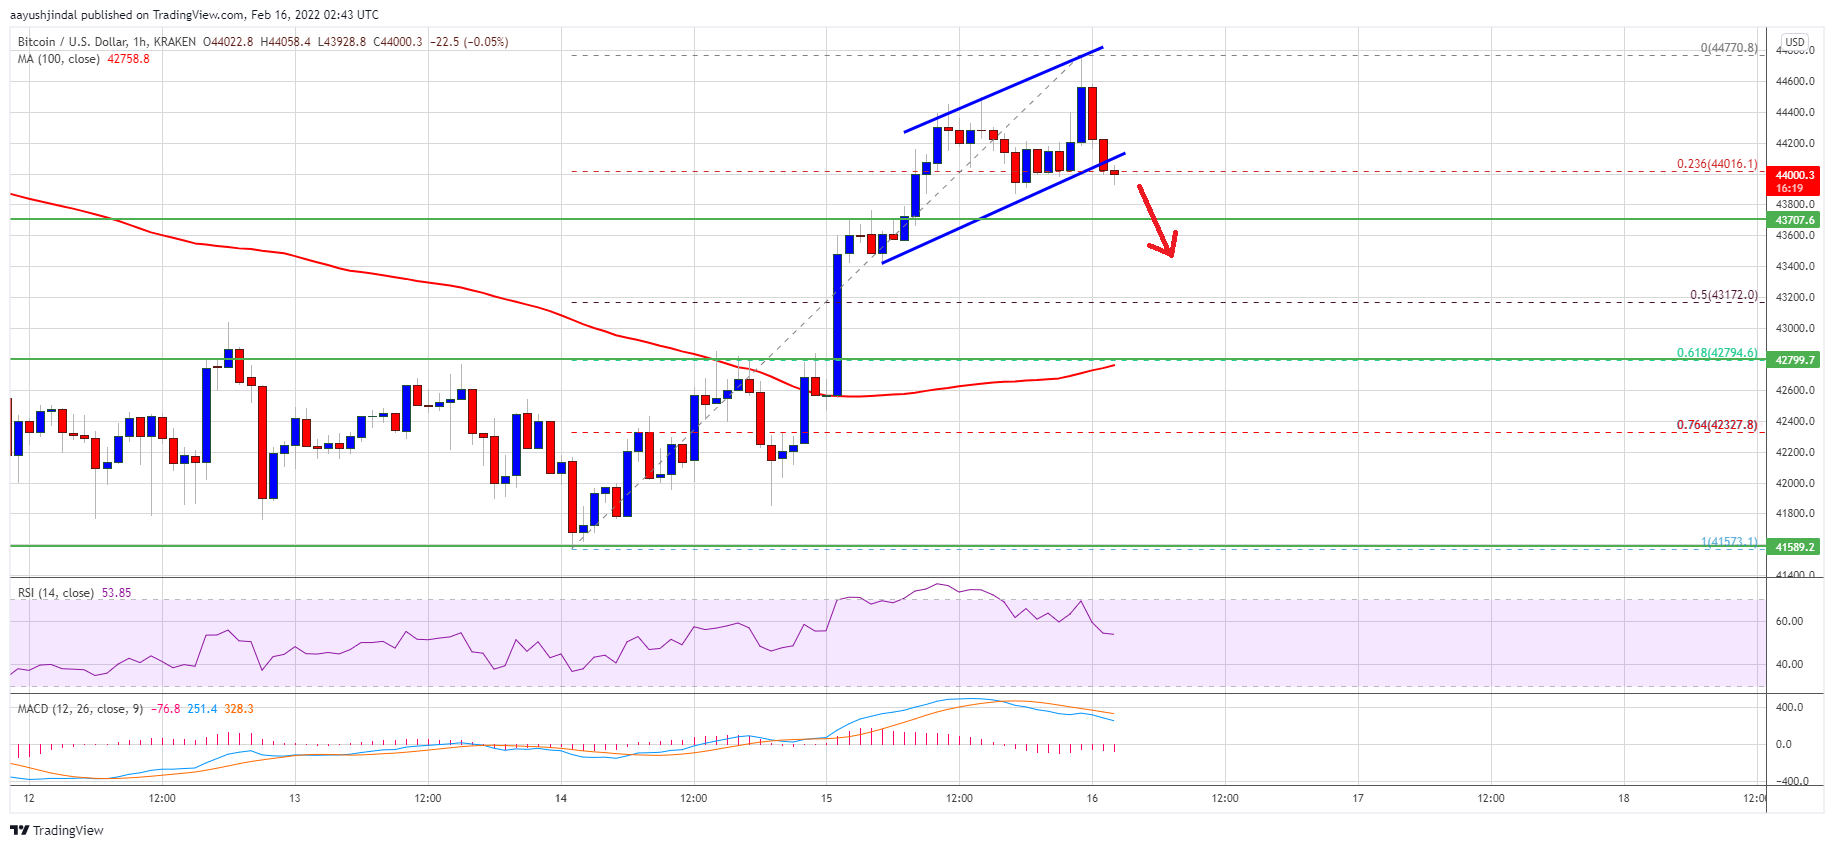
However, there was no test of the $45,000 resistance zone. A high was formed near $44,770 before the price started a downside correction. There was a break below the $44,500 support zone. Besides, there was a break below a short-term rising channel with support near $44,200 on the hourly chart of the BTC/USD pair.
Bitcoin is trading just below the 23.6% Fib retracement level of the upward move from the $41,573 swing low to $44,770 high. On the upside, the price might face resistance near the broken channel support at $44,200.
Source: BTCUSD on TradingView.com
The first major resistance is near the $44,500 level. A clear move above the $44,500 resistance zone might send the price further higher. The next major resistance is near $45,000, above which the price might rise towards the $45,500 resistance level.
Dips Limited in BTC?
If bitcoin fails to continue higher above the $44,500 resistance zone, it could start a downside correction. An immediate support on the downside is near the $43,800 zone.
The next major support is seen near the $43,150 level. It is near the 50% Fib retracement level of the upward move from the $41,573 swing low to $44,770 high. If there is a downside break below the $43,850 support zone, the price might struggle. The next support sits near $42,800 or the 100 hourly SMA, below which there is a risk of a sharp decline in the near term.
Technical indicators:
Hourly MACD – The MACD is now gaining pace in the bearish zone.
Hourly RSI (Relative Strength Index) – The RSI for BTC/USD is still above the 50 level.
Major Support Levels – $43,800, followed by $43,150.
Major Resistance Levels – $44,200, $44,500 and $45,500.
Bitcoin attempted a move towards $45,000 but failed against the US Dollar. BTC is correcting lower, but dips might be limited below $42,800.
Bitcoin extended increase above $44,000 before it faced sellers.
The price is trading above $43,500 and the 100 hourly simple moving average.
There was a break below a short-term rising channel with support near $44,200 on the hourly chart of the BTC/USD pair (data feed from Kraken).
The pair could drop to $43,000 or $42,800, where the bulls might take a stand.
Bitcoin price remained supported and extended increase above the $44,000 level. BTC even cleared the $44,500 resistance and settled above the 100 hourly simple moving average.
However, there was no test of the $45,000 resistance zone. A high was formed near $44,770 before the price started a downside correction. There was a break below the $44,500 support zone. Besides, there was a break below a short-term rising channel with support near $44,200 on the hourly chart of the BTC/USD pair.
Bitcoin is trading just below the 23.6% Fib retracement level of the upward move from the $41,573 swing low to $44,770 high. On the upside, the price might face resistance near the broken channel support at $44,200.
Source: BTCUSD on TradingView.com
The first major resistance is near the $44,500 level. A clear move above the $44,500 resistance zone might send the price further higher. The next major resistance is near $45,000, above which the price might rise towards the $45,500 resistance level.
If bitcoin fails to continue higher above the $44,500 resistance zone, it could start a downside correction. An immediate support on the downside is near the $43,800 zone.
The next major support is seen near the $43,150 level. It is near the 50% Fib retracement level of the upward move from the $41,573 swing low to $44,770 high. If there is a downside break below the $43,850 support zone, the price might struggle. The next support sits near $42,800 or the 100 hourly SMA, below which there is a risk of a sharp decline in the near term.
Technical indicators:
Hourly MACD – The MACD is now gaining pace in the bearish zone.
Hourly RSI (Relative Strength Index) – The RSI for BTC/USD is still above the 50 level.
Major Support Levels – $43,800, followed by $43,150.
Major Resistance Levels – $44,200, $44,500 and $45,500.
Tags: bitcoinbtcusdBTCUSDTxbtusd
FeedzyRead More
The bitcoin price is approaching a key technical level while PEPE and other memecoins jump…
Veteran trader Peter Brandt sparked a fresh round of chart debate around Bitcoin after posting…
Majors posted broad gains on Monday as oil eased from highs, two tankers sailed through…
Volume jumped more than 250% during the move, with traders watching whether former resistance now…
Bitcoin's convincing move above its key average indicates a strengthening of the bullish momentum.Read MoreCoinDesk:…
Bitcoin price started a steady increase above the $72,000 zone. BTC is now consolidating and…