Bitcoin remained in a bearish zone below $39,000 against the US Dollar. BTC could recover only if it manages to clear the $40,000 resistance zone.
Bitcoin is showing bearish signs below the $39,000 and $40,000 resistance levels.
The price is trading below $39,000 and the 100 hourly simple moving average.
There is a key triangle pattern forming with resistance near $39,000 on the hourly chart of the BTC/USD pair (data feed from Kraken).
The pair might start a recovery wave if there is a clear move above $39,000 and $40,000.
Bitcoin Price Remains in a Bearish Zone
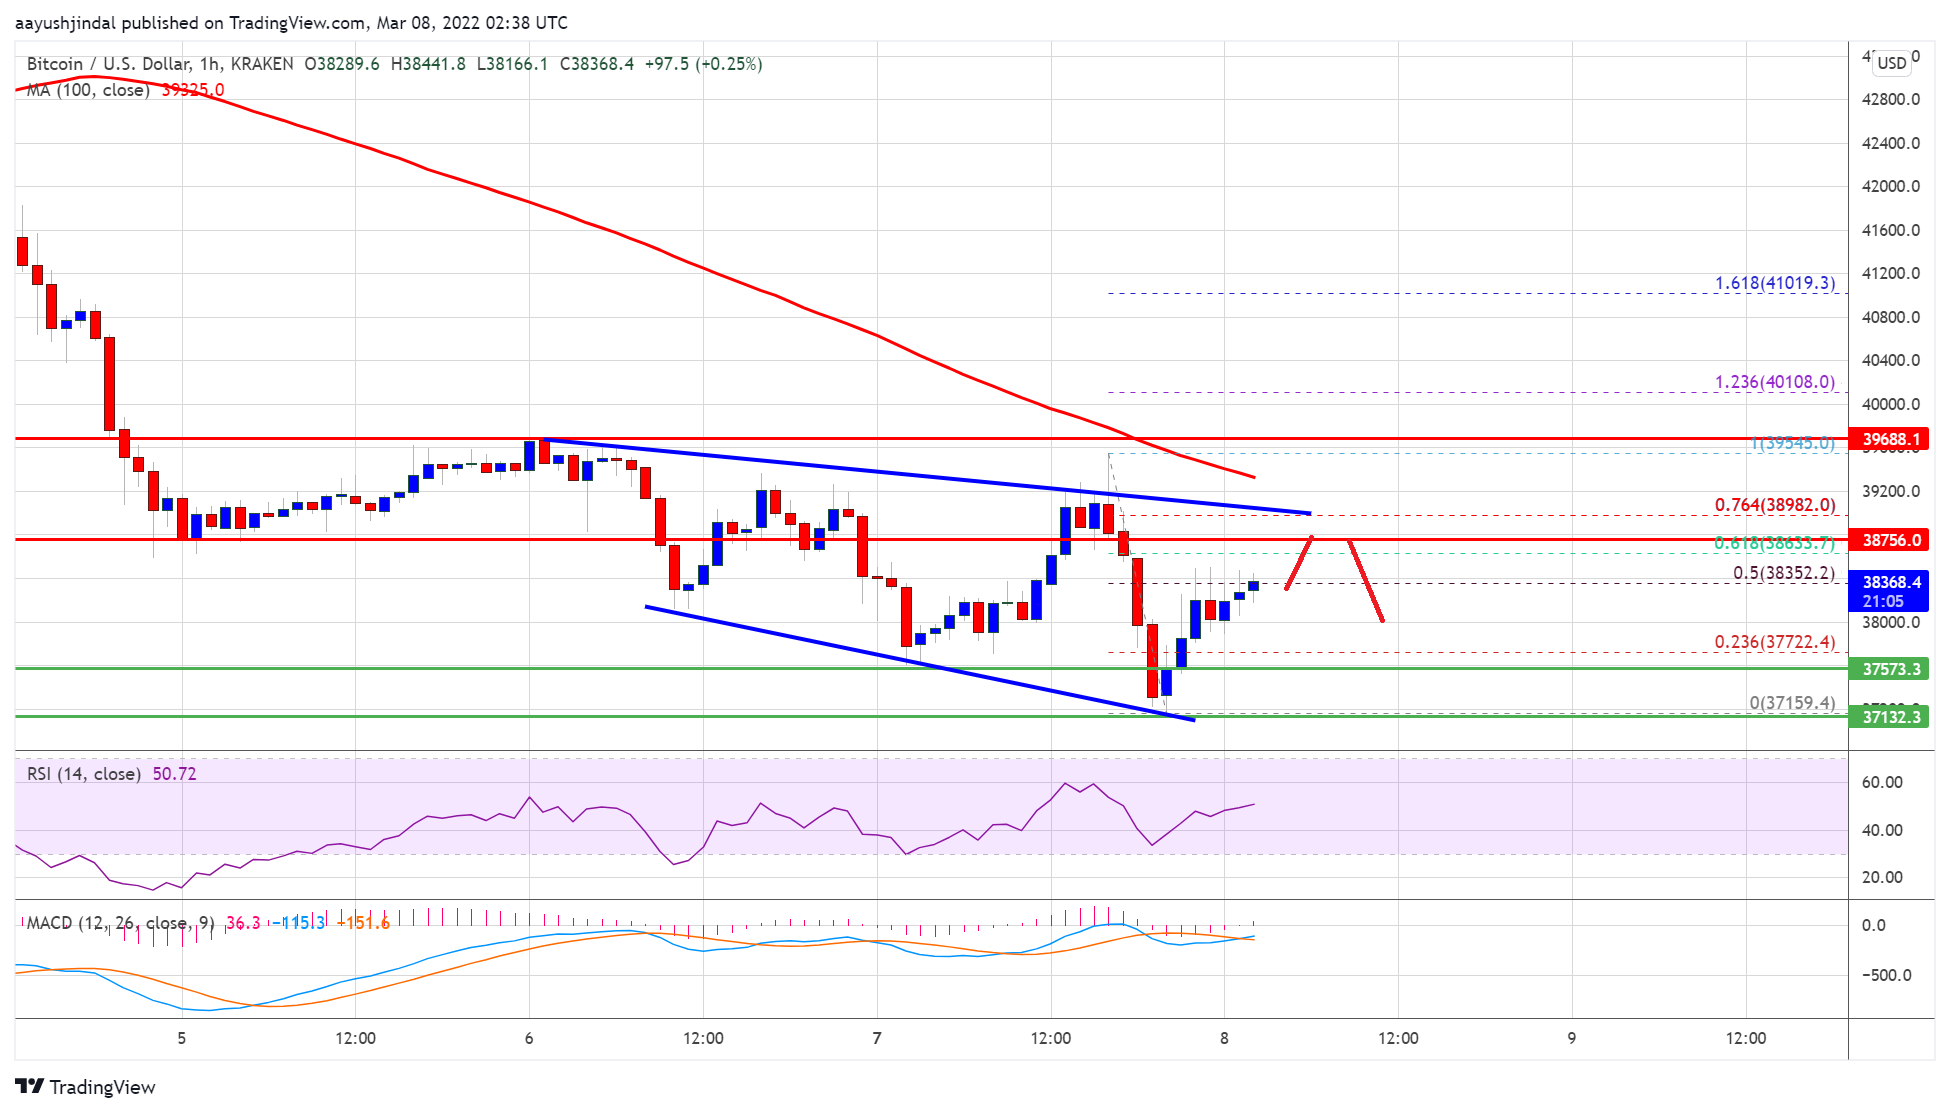
Bitcoin price settled below the $40,000 pivot level and the 100 hourly simple moving average. BTC even broke the $38,000 support level and traded as low as $37,159.
The bulls managed to protect the $37,000 support zone. It is now recovering losses and trading above $37,500. There was a move above the $38,000 resistance zone. The price is now testing the 50% Fib retracement level of the recent decline from the $39,545 swing high to $37,159 low.
On the upside, bitcoin price might face resistance near the $38,800 level. It is close to the 61.8% Fib retracement level of the recent decline from the $39,545 swing high to $37,159 low.
Source: BTCUSD on TradingView.com
There is also a key triangle pattern forming with resistance near $39,000 on the hourly chart of the BTC/USD pair. The next major resistance is near the $39,200 level and the 100 hourly simple moving average. A clear move above the $39,200 level might open the doors for a test of $40,000. A close above $40,000 could set the pace for more upsides in the near term.
More Losses in BTC?
If bitcoin fails to clear the $39,200 resistance zone, it could continue to move down. An immediate support on the downside is near the $38,000 zone.
The next major support is seen near the $37,200 level. If there is a downside break below the $37,200 support, the price might start another decline. In the stated case, there is a risk of a move towards the $35,500 level.
Technical indicators:
Hourly MACD – The MACD is now losing pace in the bearish zone.
Hourly RSI (Relative Strength Index) – The RSI for BTC/USD is now near the 50 level.
Major Support Levels – $38,000, followed by $37,200.
Major Resistance Levels – $38,800, $39,200 and $40,000.
Bitcoin remained in a bearish zone below $39,000 against the US Dollar. BTC could recover only if it manages to clear the $40,000 resistance zone.
Bitcoin is showing bearish signs below the $39,000 and $40,000 resistance levels.
The price is trading below $39,000 and the 100 hourly simple moving average.
There is a key triangle pattern forming with resistance near $39,000 on the hourly chart of the BTC/USD pair (data feed from Kraken).
The pair might start a recovery wave if there is a clear move above $39,000 and $40,000.
Bitcoin price settled below the $40,000 pivot level and the 100 hourly simple moving average. BTC even broke the $38,000 support level and traded as low as $37,159.
The bulls managed to protect the $37,000 support zone. It is now recovering losses and trading above $37,500. There was a move above the $38,000 resistance zone. The price is now testing the 50% Fib retracement level of the recent decline from the $39,545 swing high to $37,159 low.
On the upside, bitcoin price might face resistance near the $38,800 level. It is close to the 61.8% Fib retracement level of the recent decline from the $39,545 swing high to $37,159 low.
Source: BTCUSD on TradingView.com
There is also a key triangle pattern forming with resistance near $39,000 on the hourly chart of the BTC/USD pair. The next major resistance is near the $39,200 level and the 100 hourly simple moving average. A clear move above the $39,200 level might open the doors for a test of $40,000. A close above $40,000 could set the pace for more upsides in the near term.
If bitcoin fails to clear the $39,200 resistance zone, it could continue to move down. An immediate support on the downside is near the $38,000 zone.
The next major support is seen near the $37,200 level. If there is a downside break below the $37,200 support, the price might start another decline. In the stated case, there is a risk of a move towards the $35,500 level.
Technical indicators:
Hourly MACD – The MACD is now losing pace in the bearish zone.
Hourly RSI (Relative Strength Index) – The RSI for BTC/USD is now near the 50 level.
Major Support Levels – $38,000, followed by $37,200.
Major Resistance Levels – $38,800, $39,200 and $40,000.
Tags: bitcoinbtcusdBTCUSDTxbtusd
FeedzyRead More
Bitcoin’s latest stretch of sideways price action around $70,000 is being read by some traders…
Bitcoin Magazine Bitcoin Price Rises as Iran Signals Push for Full End to Conflict Bitcoin…
Your day-ahead look for March 25, 2026Read MoreCoinDesk: Bitcoin, Ethereum, Crypto News and Price Data[#item_full_content]
As gold posts its worst run since 1920, bitcoin gains ground and outperforms, pushing the…
BTC rises with equities while surging open interest and fading volatility point to leveraged positioning…
Bitcoin traders are again staring at a chart structure that resembles the setup that preceded…