Bitcoin failed to clear the $39,500 resistance zone against the US Dollar. BTC started a fresh decline and is showing bearish signs below $38,000.
Bitcoin failed to gain strength above the $39,000 level and stayed below $40,000.
The price is trading below $38,500 and the 100 hourly simple moving average.
There was a break below a key rising channel with support near $38,250 on the hourly chart of the BTC/USD pair (data feed from Kraken).
The pair remains at a risk of more downsides below the $36,300 support zone.
Bitcoin Price Struggle Continues
Bitcoin price started an upside correction above the $38,000 resistance. BTC was able to clear the $38,500 resistance and the 100 hourly simple moving average.
However, the price struggled to gain strength above the $39,000 level. It even stayed well below the $40,000 resistance zone. A high was formed near $39,250 and the price started a fresh decline. There was a sharp decline below the $38,500 level and the 100 hourly simple moving average.
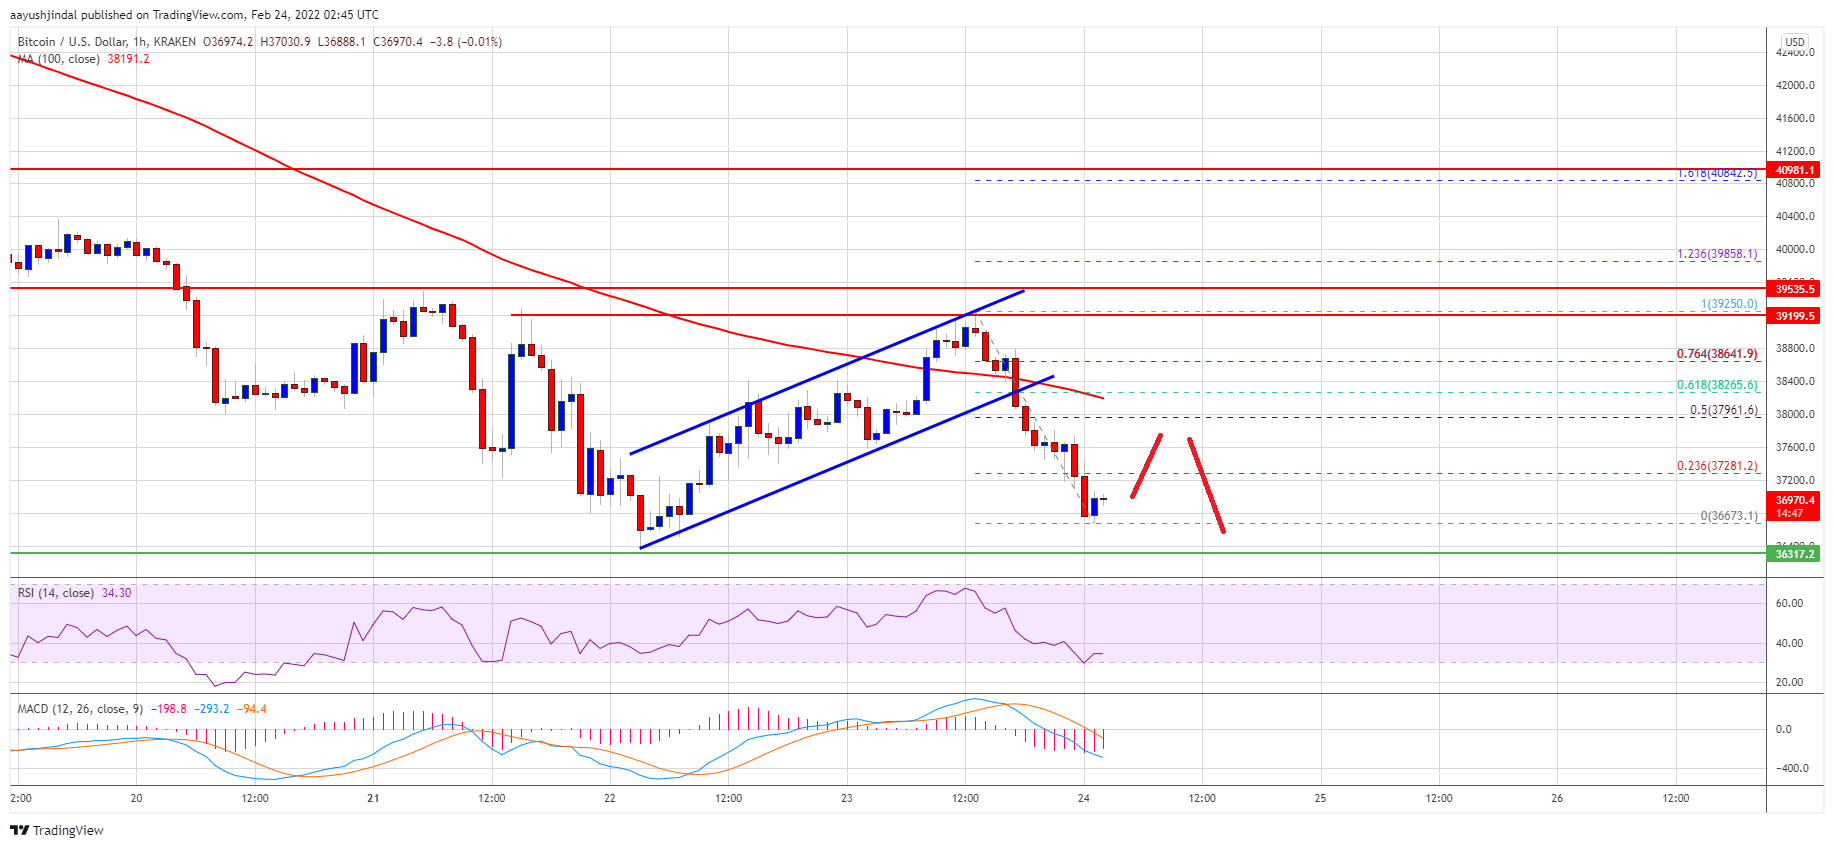
Besides, there was a break below a key rising channel with support near $38,250 on the hourly chart of the BTC/USD pair. Bitcoin price traded below $37,000 and a low is formed near $36,673.
It is now consolidating losses and facing resistance near the $37,280 level. The stated resistance is close to the 23.6% Fib retracement level of the recent decline from the $39,250 swing high to $36,673 low. The next key resistance is near the $38,000 level.
Source: BTCUSD on TradingView.com
The 50% Fib retracement level of the recent decline from the $39,250 swing high to $36,673 low is also near $38,000 along with the 100 hourly simple moving average. A clear move above the $38,000 resistance could send the price to $39,000. To gain bullish momentum, the price must settle above the $39,500 level.
More Losses in BTC?
If bitcoin fails to start a recovery wave above the $37,280 resistance zone, it could continue to move down. An immediate support on the downside is near the $36,650 zone.
The next major support is seen near the $36,300 level. If there is a downside break below the $36,300 support zone, the price might gain bearish momentum towards $35,000.
Technical indicators:
Hourly MACD – The MACD is now gaining pace in the bearish zone.
Hourly RSI (Relative Strength Index) – The RSI for BTC/USD is well below the 50 level.
Major Support Levels – $36,300, followed by $35,000.
Major Resistance Levels – $38,000, $38,400 and $39,500.
Bitcoin failed to clear the $39,500 resistance zone against the US Dollar. BTC started a fresh decline and is showing bearish signs below $38,000.
Bitcoin failed to gain strength above the $39,000 level and stayed below $40,000.
The price is trading below $38,500 and the 100 hourly simple moving average.
There was a break below a key rising channel with support near $38,250 on the hourly chart of the BTC/USD pair (data feed from Kraken).
The pair remains at a risk of more downsides below the $36,300 support zone.
Bitcoin price started an upside correction above the $38,000 resistance. BTC was able to clear the $38,500 resistance and the 100 hourly simple moving average.
However, the price struggled to gain strength above the $39,000 level. It even stayed well below the $40,000 resistance zone. A high was formed near $39,250 and the price started a fresh decline. There was a sharp decline below the $38,500 level and the 100 hourly simple moving average.
Besides, there was a break below a key rising channel with support near $38,250 on the hourly chart of the BTC/USD pair. Bitcoin price traded below $37,000 and a low is formed near $36,673.
It is now consolidating losses and facing resistance near the $37,280 level. The stated resistance is close to the 23.6% Fib retracement level of the recent decline from the $39,250 swing high to $36,673 low. The next key resistance is near the $38,000 level.
Source: BTCUSD on TradingView.com
The 50% Fib retracement level of the recent decline from the $39,250 swing high to $36,673 low is also near $38,000 along with the 100 hourly simple moving average. A clear move above the $38,000 resistance could send the price to $39,000. To gain bullish momentum, the price must settle above the $39,500 level.
If bitcoin fails to start a recovery wave above the $37,280 resistance zone, it could continue to move down. An immediate support on the downside is near the $36,650 zone.
The next major support is seen near the $36,300 level. If there is a downside break below the $36,300 support zone, the price might gain bearish momentum towards $35,000.
Technical indicators:
Hourly MACD – The MACD is now gaining pace in the bearish zone.
Hourly RSI (Relative Strength Index) – The RSI for BTC/USD is well below the 50 level.
Major Support Levels – $36,300, followed by $35,000.
Major Resistance Levels – $38,000, $38,400 and $39,500.
Tags: bitcoinbtcusdBTCUSDTxbtusd
FeedzyRead More
Strategy’s stock is trading below the value of its own Bitcoin holdings — an unusual…
The cryptocurrency community pushed back, with Michael Saylor saying Bitcoin has no issuer, promoter, or…
Crypto pundit Crypto Bully has shared his base case for Bitcoin and what to expect…
The past week recorded a significant change in the Bitcoin price action, where there was…
The largest publicly traded corporate holder of bitcoin would need to buy roughly 6,158 BTC…
On-chain analytics firm Glassnode has highlighted how Bitcoin has only seen a relatively thin accumulation…