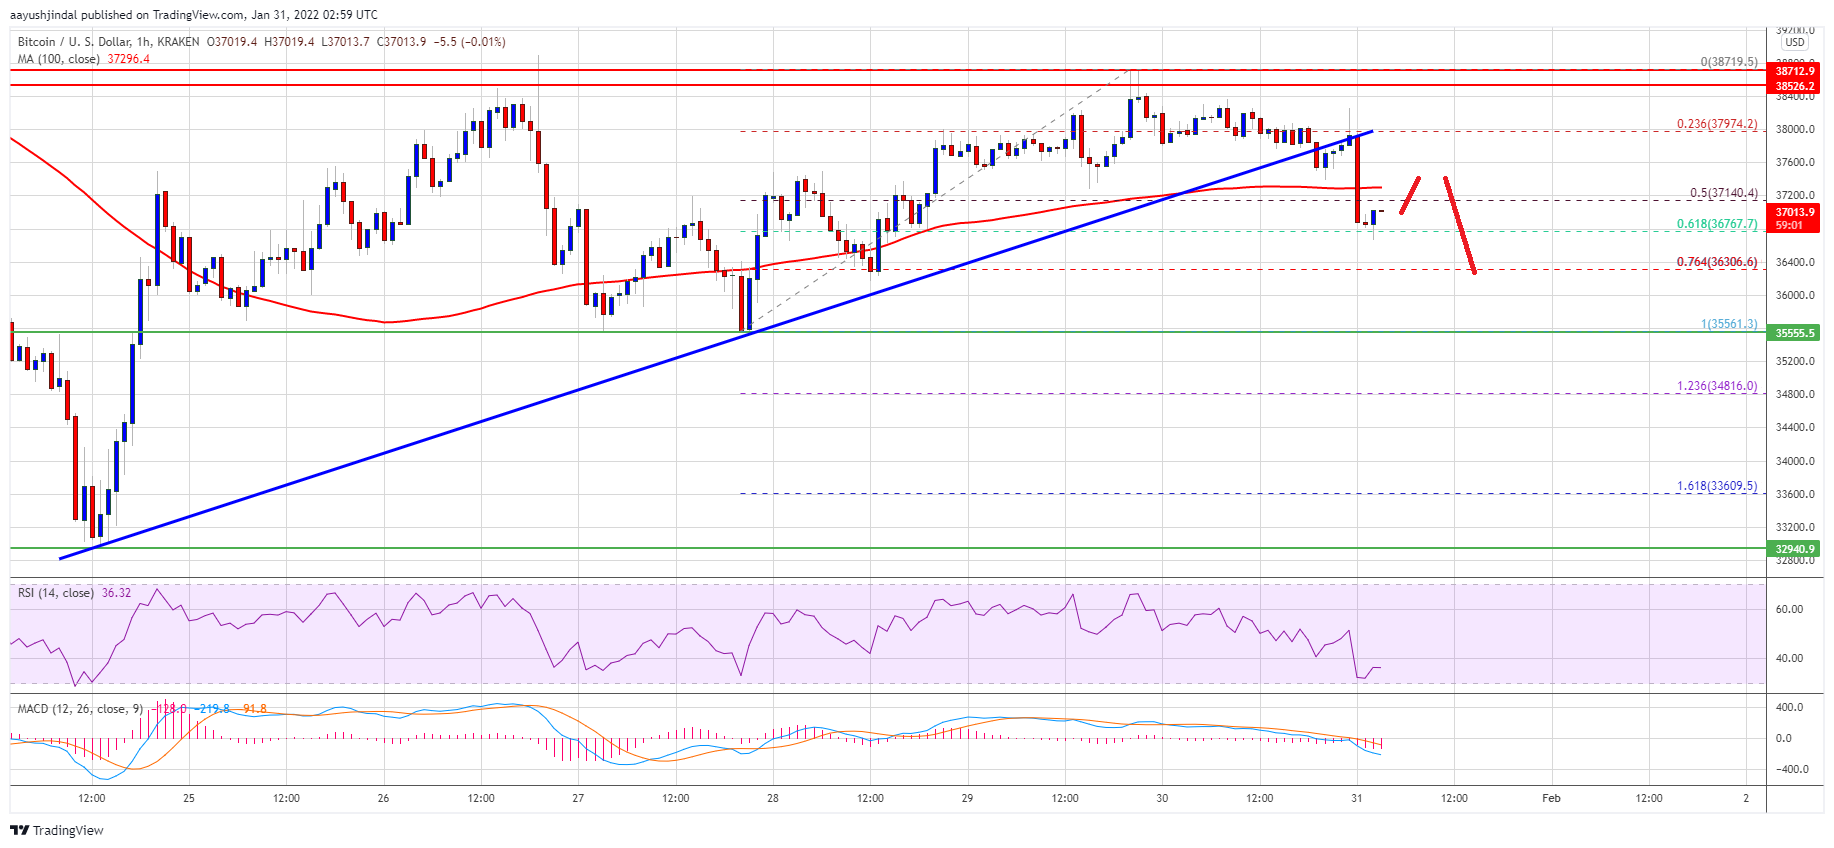
Bitcoin struggled to clear the $38,800 resistance zone against the US Dollar. BTC is moving lower and might decline below the $35,000 support level.
Bitcoin started an upside correction but failed to clear the $38,800 resistance zone.
The price is now trading below $37,500 and the 100 hourly simple moving average.
There was a break below a key bullish trend line with support near $37,650 on the hourly chart of the BTC/USD pair (data feed from Kraken).
The pair could continue to move down if it stays below the $38,000 resistance zone.
Bitcoin Price Starts Fresh Decrease
Bitcoin price recovered above the $37,000 resistance zone. BTC even climbed above the $38,000 resistance zone and the 100 hourly simple moving average.
However, the price failed to clear the $38,800 resistance zone. A high was formed near $38,719 and the price started a fresh decline. There was a move below the $38,000 support level. The bears pushed the price below the 50% Fib retracement level of the upward move from the $35,561 swing low to $38,719 high.
Besides, there was a break below a key bullish trend line with support near $37,650 on the hourly chart of the BTC/USD pair. The pair traded below $37,200 and the 100 hourly simple moving average.
It is now testing the $36,800 support zone. The stated level is near the 61.8% Fib retracement level of the upward move from the $35,561 swing low to $38,719 high. On the upside, an initial resistance is near the $37,400 level and the 100 hourly SMA.
Source: BTCUSD on TradingView.com
The first major resistance is near the $38,000 zone. The main resistance is still near the $38,800 zone. An upside break above the $38,800 resistance could start a steady upward move. The next key resistance is near the $40,000 level, above which the bulls might gain strength.
More Losses in BTC?
If bitcoin fails to start a fresh increase above $38,000, it could continue to move down. An immediate support on the downside is near the $36,000 zone.
The first major support is seen near the $35,500 zone. A downside break below the $35,500 support zone may perhaps push the price towards the $34,000 support zone.
Technical indicators:
Hourly MACD – The MACD is now gaining pace in the bearish zone.
Hourly RSI (Relative Strength Index) – The RSI for BTC/USD is now below the 50 level.
Major Support Levels – $36,500, followed by $35,500.
Major Resistance Levels – $37,400, $38,000 and $38,800.
Bitcoin struggled to clear the $38,800 resistance zone against the US Dollar. BTC is moving lower and might decline below the $35,000 support level.
Bitcoin started an upside correction but failed to clear the $38,800 resistance zone.
The price is now trading below $37,500 and the 100 hourly simple moving average.
There was a break below a key bullish trend line with support near $37,650 on the hourly chart of the BTC/USD pair (data feed from Kraken).
The pair could continue to move down if it stays below the $38,000 resistance zone.
Bitcoin price recovered above the $37,000 resistance zone. BTC even climbed above the $38,000 resistance zone and the 100 hourly simple moving average.
However, the price failed to clear the $38,800 resistance zone. A high was formed near $38,719 and the price started a fresh decline. There was a move below the $38,000 support level. The bears pushed the price below the 50% Fib retracement level of the upward move from the $35,561 swing low to $38,719 high.
Besides, there was a break below a key bullish trend line with support near $37,650 on the hourly chart of the BTC/USD pair. The pair traded below $37,200 and the 100 hourly simple moving average.
It is now testing the $36,800 support zone. The stated level is near the 61.8% Fib retracement level of the upward move from the $35,561 swing low to $38,719 high. On the upside, an initial resistance is near the $37,400 level and the 100 hourly SMA.
Source: BTCUSD on TradingView.com
The first major resistance is near the $38,000 zone. The main resistance is still near the $38,800 zone. An upside break above the $38,800 resistance could start a steady upward move. The next key resistance is near the $40,000 level, above which the bulls might gain strength.
If bitcoin fails to start a fresh increase above $38,000, it could continue to move down. An immediate support on the downside is near the $36,000 zone.
The first major support is seen near the $35,500 zone. A downside break below the $35,500 support zone may perhaps push the price towards the $34,000 support zone.
Technical indicators:
Hourly MACD – The MACD is now gaining pace in the bearish zone.
Hourly RSI (Relative Strength Index) – The RSI for BTC/USD is now below the 50 level.
Major Support Levels – $36,500, followed by $35,500.
Major Resistance Levels – $37,400, $38,000 and $38,800.
Tags: bitcoinbtcusdBTCUSDTxbtusd
FeedzyRead More
The bridging protocol's team wants to exchange ACX tokens for equity in a new U.S.…
Brent crude surged 10% after attacks on two oil tankers in Iraqi waters, with the…
Bitcoin price failed to extend its recovery wave above the $70,500 zone. BTC is now…
Bitcoin Magazine Coinbase CPO Rejects Claims of Opposing Bitcoin Tax Relief as Jack Dorsey Demands…
The security architecture surrounding Bitcoin continues to evolve as new infrastructure emerges to support self-custody…
Bitcoin is up about 7% from the Sunday lows, even as equities and gold tread…