Bitcoin spiked above the $20,500 resistance against the US Dollar. BTC is now struggling near $19,800, with a major support near the $19,600 zone.
Bitcoin made another attempt to gain strength above $20,500 but failed.
The price is now trading above the $19,500 level and the 100 hourly simple moving average.
There is a key bullish trend line forming with support near $19,550 on the hourly chart of the BTC/USD pair (data feed from Kraken).
The pair could rise again unless there is a clear move below the $19,500 support zone.
Bitcoin Price Faces Hurdles
Bitcoin price remained supported above the $19,500 zone. BTC started another increase and climbed above the $20,000 resistance zone.
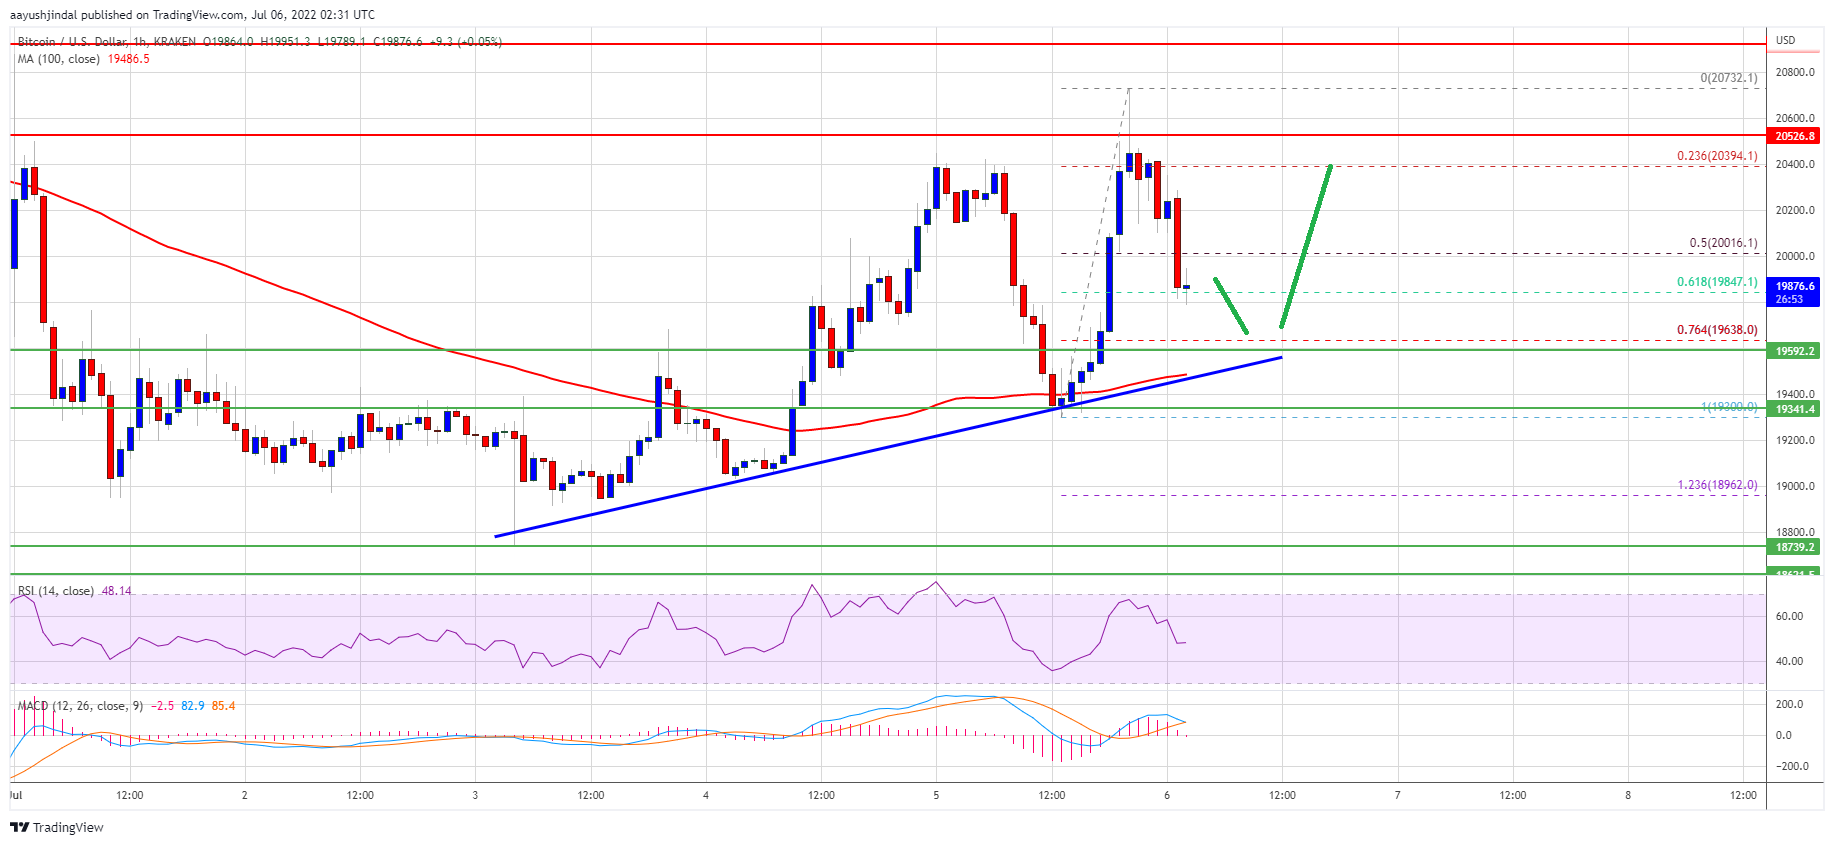
There was a spike above the $20,500 resistance zone but the bulls failed to gain strength. A high was formed near $20,732 and the price corrected gains. There was a drop below the $20,200 and $20,000 support levels.
Bitcoin traded below the 50% Fib retracement level of the upward move from the $19,300 swing low to $20,732 swing high. It is now trading above the $19,500 level and the 100 hourly simple moving average. There is also a key bullish trend line forming with support near $19,550 on the hourly chart of the BTC/USD pair.
On the upside, the price is facing resistance near the $20,000 and $20,200 levels. The next key resistance is near the $20,500 zone. A close above the $20,500 resistance zone could open the doors for a decent increase.
Source: BTCUSD on TradingView.com
In the stated case, the price could climb towards the $21,200 level. The next major resistance sits near the $21,500 level.
More Losses in BTC?
If bitcoin fails to clear the $20,500 resistance zone, it could continue to move down. An immediate support on the downside is near the $19,650 level. It is near the 76.4% Fib retracement level of the upward move from the $19,300 swing low to $20,732 swing high.
The next major support now sits near the $19,500 level or the trend line zone. A close below the $19,500 support zone could increase selling pressure. In the stated case, the price may perhaps decline towards the $18,740 level.
Technical indicators:
Hourly MACD – The MACD is now losing pace in the bullish zone.
Hourly RSI (Relative Strength Index) – The RSI for BTC/USD is now near the 50 level.
Major Support Levels – $19,650, followed by $19,500.
Major Resistance Levels – $20,200, $20,500 and $21,200.
Bitcoin spiked above the $20,500 resistance against the US Dollar. BTC is now struggling near $19,800, with a major support near the $19,600 zone.
Bitcoin made another attempt to gain strength above $20,500 but failed.
The price is now trading above the $19,500 level and the 100 hourly simple moving average.
There is a key bullish trend line forming with support near $19,550 on the hourly chart of the BTC/USD pair (data feed from Kraken).
The pair could rise again unless there is a clear move below the $19,500 support zone.
Bitcoin price remained supported above the $19,500 zone. BTC started another increase and climbed above the $20,000 resistance zone.
There was a spike above the $20,500 resistance zone but the bulls failed to gain strength. A high was formed near $20,732 and the price corrected gains. There was a drop below the $20,200 and $20,000 support levels.
Bitcoin traded below the 50% Fib retracement level of the upward move from the $19,300 swing low to $20,732 swing high. It is now trading above the $19,500 level and the 100 hourly simple moving average. There is also a key bullish trend line forming with support near $19,550 on the hourly chart of the BTC/USD pair.
On the upside, the price is facing resistance near the $20,000 and $20,200 levels. The next key resistance is near the $20,500 zone. A close above the $20,500 resistance zone could open the doors for a decent increase.
Source: BTCUSD on TradingView.com
In the stated case, the price could climb towards the $21,200 level. The next major resistance sits near the $21,500 level.
If bitcoin fails to clear the $20,500 resistance zone, it could continue to move down. An immediate support on the downside is near the $19,650 level. It is near the 76.4% Fib retracement level of the upward move from the $19,300 swing low to $20,732 swing high.
The next major support now sits near the $19,500 level or the trend line zone. A close below the $19,500 support zone could increase selling pressure. In the stated case, the price may perhaps decline towards the $18,740 level.
Technical indicators:
Hourly MACD – The MACD is now losing pace in the bullish zone.
Hourly RSI (Relative Strength Index) – The RSI for BTC/USD is now near the 50 level.
Major Support Levels – $19,650, followed by $19,500.
Major Resistance Levels – $20,200, $20,500 and $21,200.
Tags: bitcoinbtcusdBTCUSDTxbtusd
FeedzyRead More
Each escalation in the Iran conflict has been larger than the last, but each bitcoin…
The Bitcoin price has not particularly impressed over the past two weeks, but it appears…
Bitcoin’s extended pullback from its all-time high has left traders in uncertainty, and many investors…
Bitcoin recently pushed into a key liquidity pocket near the $73,000 level, briefly tapping overhead…
The price of Bitcoin put in another interesting performance over the past week, as the…
Strategy’s stock is trading below the value of its own Bitcoin holdings — an unusual…