Bitcoin started a recovery wave above $36,000 against the US Dollar. BTC must settle above the $38,000 zone to start a steady upward move.
Bitcoin is trying to clear the $37,500 and $38,000 resistance levels.
The price is now trading above $36,500 and the 100 hourly simple moving average.
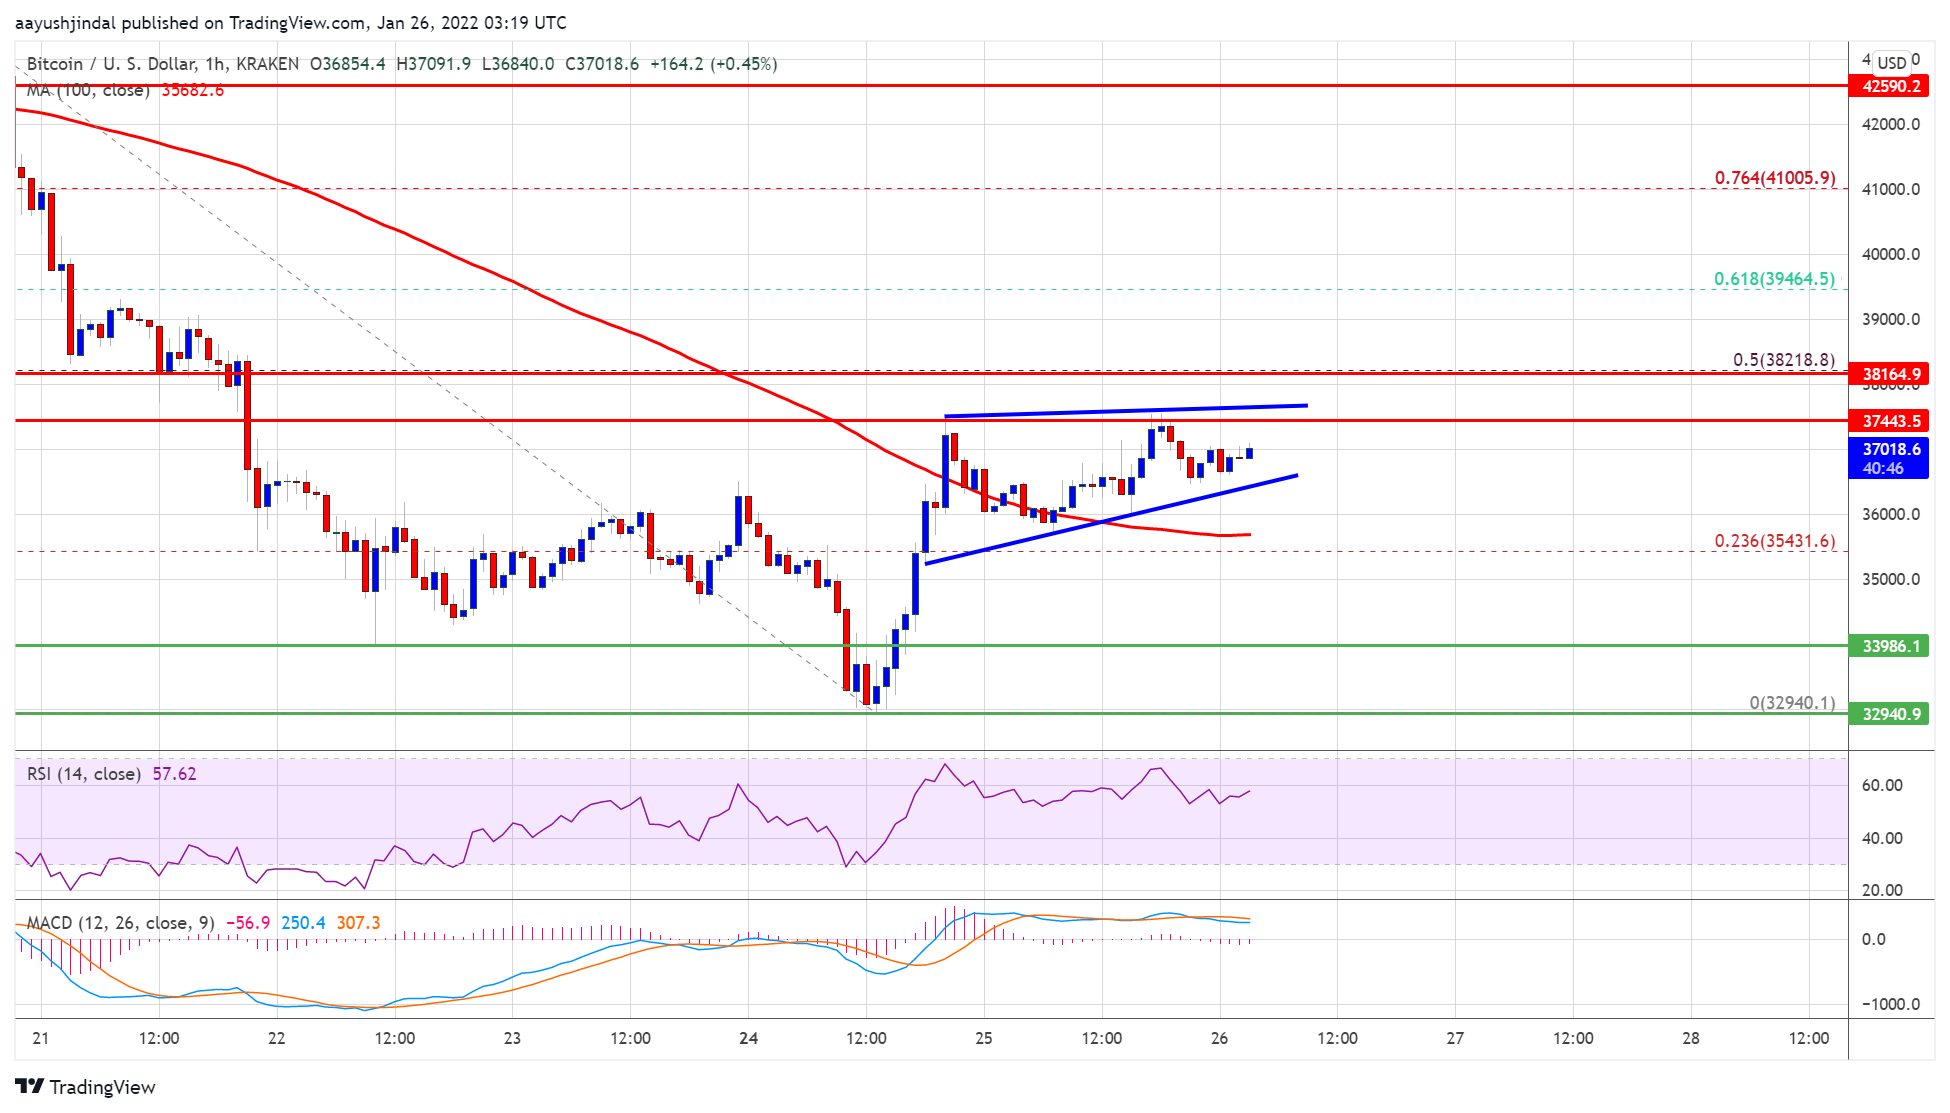
There is a key breakout pattern forming with resistance near $37,500 on the hourly chart of the BTC/USD pair (data feed from Kraken).
The pair could start a steady upward move if there is a clear move above the $38,000 resistance.
Bitcoin Price Eyes Upside Continuation
Bitcoin price managed to stay above the $35,000 zone and started a recovery wave. BTC climbed above the $36,000 resistance zone to move into a short-term bullish zone.
There was a break above the $36,500 and $36,800 resistance levels. Besides, there was a move above the 23.6% Fib retracement level of the key drop from the $43,495 swing high to $32,950 low. It is now consolidating near the $37,000 level and trading well above the 100 hourly simple moving average.
On the upside, an initial resistance is near the $37,400 level. There is also a key breakout pattern forming with resistance near $37,500 on the hourly chart of the BTC/USD pair.
Source: BTCUSD on TradingView.com
The first major resistance is near the $38,200 zone. It is near the 50% Fib retracement level of the key drop from the $43,495 swing high to $32,950 low. An upside break above the $38,200 resistance could start a steady upward move. The next key resistance is near the $49,200 level, above which the bulls might aim a test of $40,000. Any more gains might send bitcoin towards the $41,200 level.
Fresh Decline in BTC?
If bitcoin fails to start a fresh increase above $38,200, it could start another decline. An immediate support on the downside is near the $36,800 zone.
The first major support is seen near the $36,000 zone and the 100 hourly SMA. A downside break below the $36,000 support zone may perhaps start a fresh decline. The next major support is near $35,400, below which the price could revisit $34,000.
Technical indicators:
Hourly MACD – The MACD is now gaining pace in the bullish zone.
Hourly RSI (Relative Strength Index) – The RSI for BTC/USD is now above the 50 level.
Major Support Levels – $36,000, followed by $35,400.
Major Resistance Levels – $37,400, $38,000 and $38,200.
Bitcoin started a recovery wave above $36,000 against the US Dollar. BTC must settle above the $38,000 zone to start a steady upward move.
Bitcoin is trying to clear the $37,500 and $38,000 resistance levels.
The price is now trading above $36,500 and the 100 hourly simple moving average.
There is a key breakout pattern forming with resistance near $37,500 on the hourly chart of the BTC/USD pair (data feed from Kraken).
The pair could start a steady upward move if there is a clear move above the $38,000 resistance.
Bitcoin price managed to stay above the $35,000 zone and started a recovery wave. BTC climbed above the $36,000 resistance zone to move into a short-term bullish zone.
There was a break above the $36,500 and $36,800 resistance levels. Besides, there was a move above the 23.6% Fib retracement level of the key drop from the $43,495 swing high to $32,950 low. It is now consolidating near the $37,000 level and trading well above the 100 hourly simple moving average.
On the upside, an initial resistance is near the $37,400 level. There is also a key breakout pattern forming with resistance near $37,500 on the hourly chart of the BTC/USD pair.
Source: BTCUSD on TradingView.com
The first major resistance is near the $38,200 zone. It is near the 50% Fib retracement level of the key drop from the $43,495 swing high to $32,950 low. An upside break above the $38,200 resistance could start a steady upward move. The next key resistance is near the $49,200 level, above which the bulls might aim a test of $40,000. Any more gains might send bitcoin towards the $41,200 level.
If bitcoin fails to start a fresh increase above $38,200, it could start another decline. An immediate support on the downside is near the $36,800 zone.
The first major support is seen near the $36,000 zone and the 100 hourly SMA. A downside break below the $36,000 support zone may perhaps start a fresh decline. The next major support is near $35,400, below which the price could revisit $34,000.
Technical indicators:
Hourly MACD – The MACD is now gaining pace in the bullish zone.
Hourly RSI (Relative Strength Index) – The RSI for BTC/USD is now above the 50 level.
Major Support Levels – $36,000, followed by $35,400.
Major Resistance Levels – $37,400, $38,000 and $38,200.
Tags: bitcoinbtcusdBTCUSDTxbtusd
FeedzyRead More
Coinbase now allows users to borrow the USDC stablecoin against their bitcoin at a fixed…
Bitcoin’s 10% September gain puts it on track for a rare three-month winning streak last…
Falling oil eased inflation worries through the Asian session, while a bill to make the…
Bitcoin Magazine Bitcoin Investors Buy Nearly $1B in BTC ETFs as Bull Market Returns The…
Bitcoin Magazine Bitcoin’s Bull Run Is Back — and the Data Agrees Bitcoin’s run this…
Bitcoin Magazine Feds Probing Binance Over Iran’s Bitcoin Use: Report Federal prosecutors — including the…