Bitcoin started a strong decline below the $37,500 support against the US Dollar. BTC even traded below $35,000 and might continue to move down towards $32,000.
Bitcoin started a strong decline below the $36,500 and $35,500 levels.
The price is now trading below $35,000 and the 100 hourly simple moving average.
There is a key bearish trend line forming with resistance near $34,200 on the hourly chart of the BTC/USD pair (data feed from Kraken).
The pair might accelerate further lower below the $33,500 support zone in the near term.
Bitcoin Price Settles Below $35K
Bitcoin price struggled to stay above the $36,000 support zone and extended downsides. BTC traded below the key $35,500 and $35,000 support levels to move further into a bearish zone.
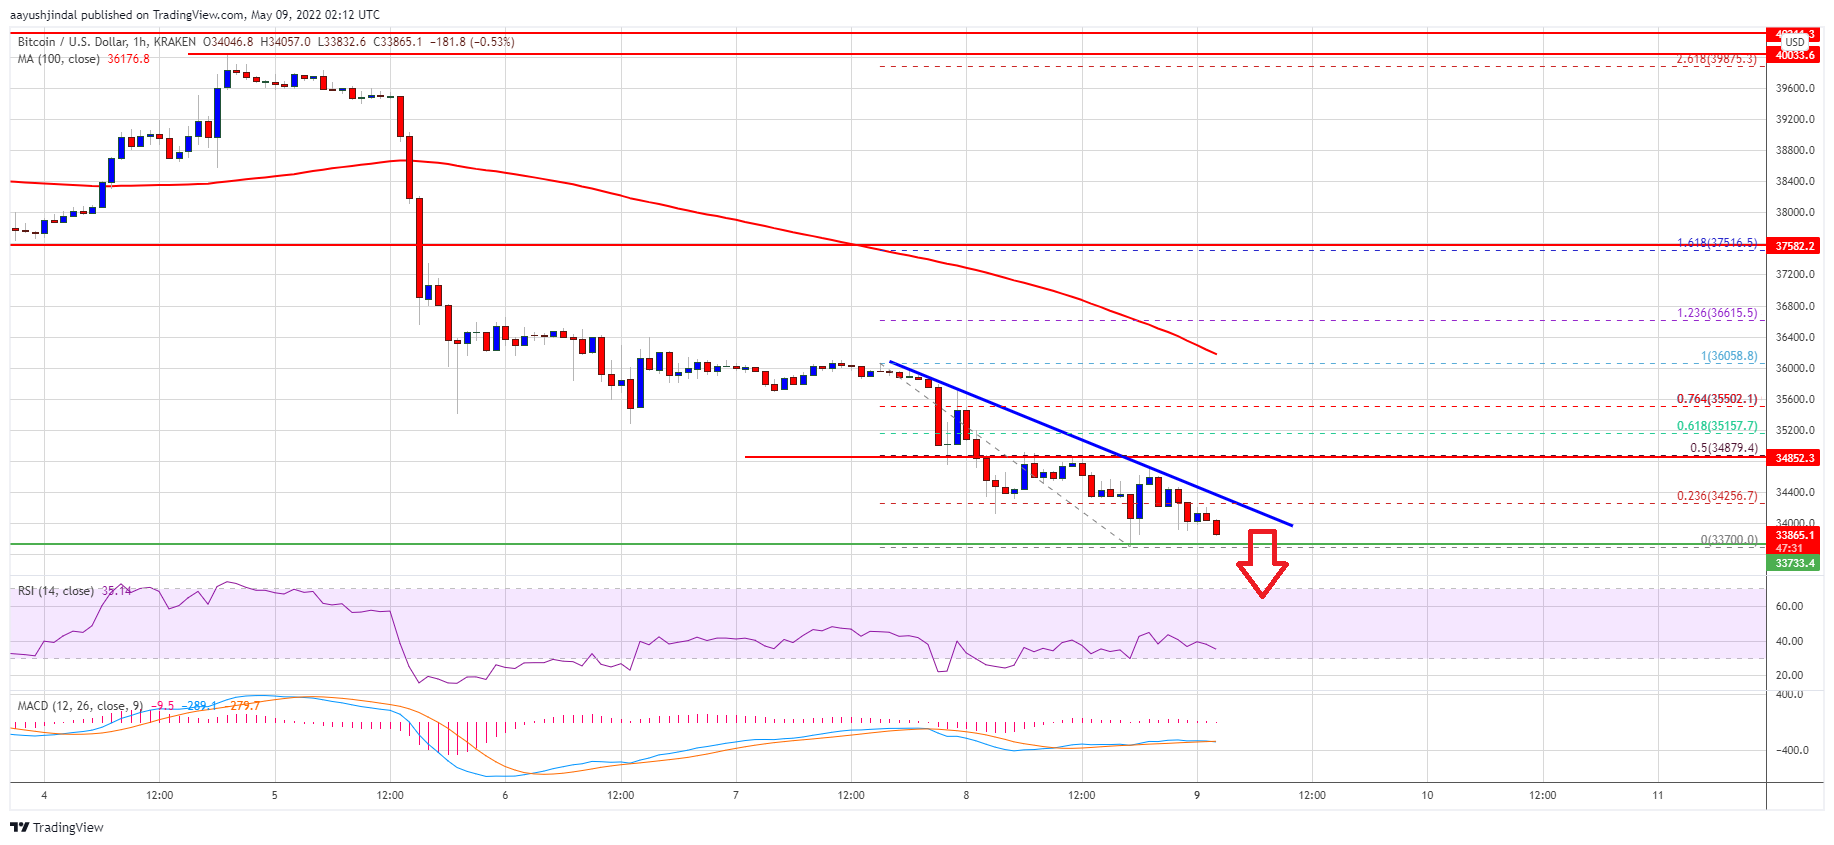
There was a close below $35,000 and the 100 hourly simple moving average. The price even traded below the $34,000 level and traded to a new multi-week low at $33,700. It is now consolidating losses and showing bearish signs below $34,000.
On the upside, bitcoin price is now facing resistance near the $34,000 level. The next key resistance could be near the $34,200 level. There is also a key bearish trend line forming with resistance near $34,200 on the hourly chart of the BTC/USD pair. The trend line is near the 23.6% Fib retracement level of the downward move from the $36,058 swing high to $33,700 low.
Source: BTCUSD on TradingView.com
The main resistance is now forming near the $35,000 level. It is near the 50% Fib retracement level of the downward move from the $36,058 swing high to $33,700 low. To start a fresh increase, the price must settle above the $35,000 level.
More Losses in BTC?
If bitcoin fails to clear the $35,000 resistance zone, it could continue to move down. An immediate support on the downside is near the $33,700 level.
The next major support is seen near the $33,500 level. A downside break below the $33,500 support might spark another sharp decline. The next major support could be $32,500. Any more losses might send the price towards the $32,000 support zone.
Technical indicators:
Hourly MACD – The MACD is now gaining pace in the bearish zone.
Hourly RSI (Relative Strength Index) – The RSI for BTC/USD is now below the 50 level.
Major Support Levels – $33,500, followed by $32,000.
Major Resistance Levels – $34,000, $34,200 and $35,000.
Bitcoin started a strong decline below the $37,500 support against the US Dollar. BTC even traded below $35,000 and might continue to move down towards $32,000.
Bitcoin started a strong decline below the $36,500 and $35,500 levels.
The price is now trading below $35,000 and the 100 hourly simple moving average.
There is a key bearish trend line forming with resistance near $34,200 on the hourly chart of the BTC/USD pair (data feed from Kraken).
The pair might accelerate further lower below the $33,500 support zone in the near term.
Bitcoin price struggled to stay above the $36,000 support zone and extended downsides. BTC traded below the key $35,500 and $35,000 support levels to move further into a bearish zone.
There was a close below $35,000 and the 100 hourly simple moving average. The price even traded below the $34,000 level and traded to a new multi-week low at $33,700. It is now consolidating losses and showing bearish signs below $34,000.
On the upside, bitcoin price is now facing resistance near the $34,000 level. The next key resistance could be near the $34,200 level. There is also a key bearish trend line forming with resistance near $34,200 on the hourly chart of the BTC/USD pair. The trend line is near the 23.6% Fib retracement level of the downward move from the $36,058 swing high to $33,700 low.
Source: BTCUSD on TradingView.com
The main resistance is now forming near the $35,000 level. It is near the 50% Fib retracement level of the downward move from the $36,058 swing high to $33,700 low. To start a fresh increase, the price must settle above the $35,000 level.
If bitcoin fails to clear the $35,000 resistance zone, it could continue to move down. An immediate support on the downside is near the $33,700 level.
The next major support is seen near the $33,500 level. A downside break below the $33,500 support might spark another sharp decline. The next major support could be $32,500. Any more losses might send the price towards the $32,000 support zone.
Technical indicators:
Hourly MACD – The MACD is now gaining pace in the bearish zone.
Hourly RSI (Relative Strength Index) – The RSI for BTC/USD is now below the 50 level.
Major Support Levels – $33,500, followed by $32,000.
Major Resistance Levels – $34,000, $34,200 and $35,000.
Tags: bitcoinbtcusdBTCUSDTxbtusd
FeedzyRead More
A tiny Strategy sale raised a bigger question about Saylor’s never-sell stance, while easing Iran…
TL;DR Aave Labs has proposed onboarding Circle Wrapped Bitcoin, or cirBTC, to Aave V3 Core…
Bitcoin Magazine Standard Chartered Calls Crypto Bottom as Bitcoin Price Recovers From $59,000 Low Standard…
Senior market analyst Geoffrey Kendrick pointed to the SpaceX IPO and a potential U.S.-Iran peace…
Bitcoin ETF investors have pulled billions this year, but the broader crypto ETF market remains…
Bitcoin Magazine SpaceX Officially Joins Public Bitcoin Leaderboard as 8th Largest Holder With 18,712 BTC…