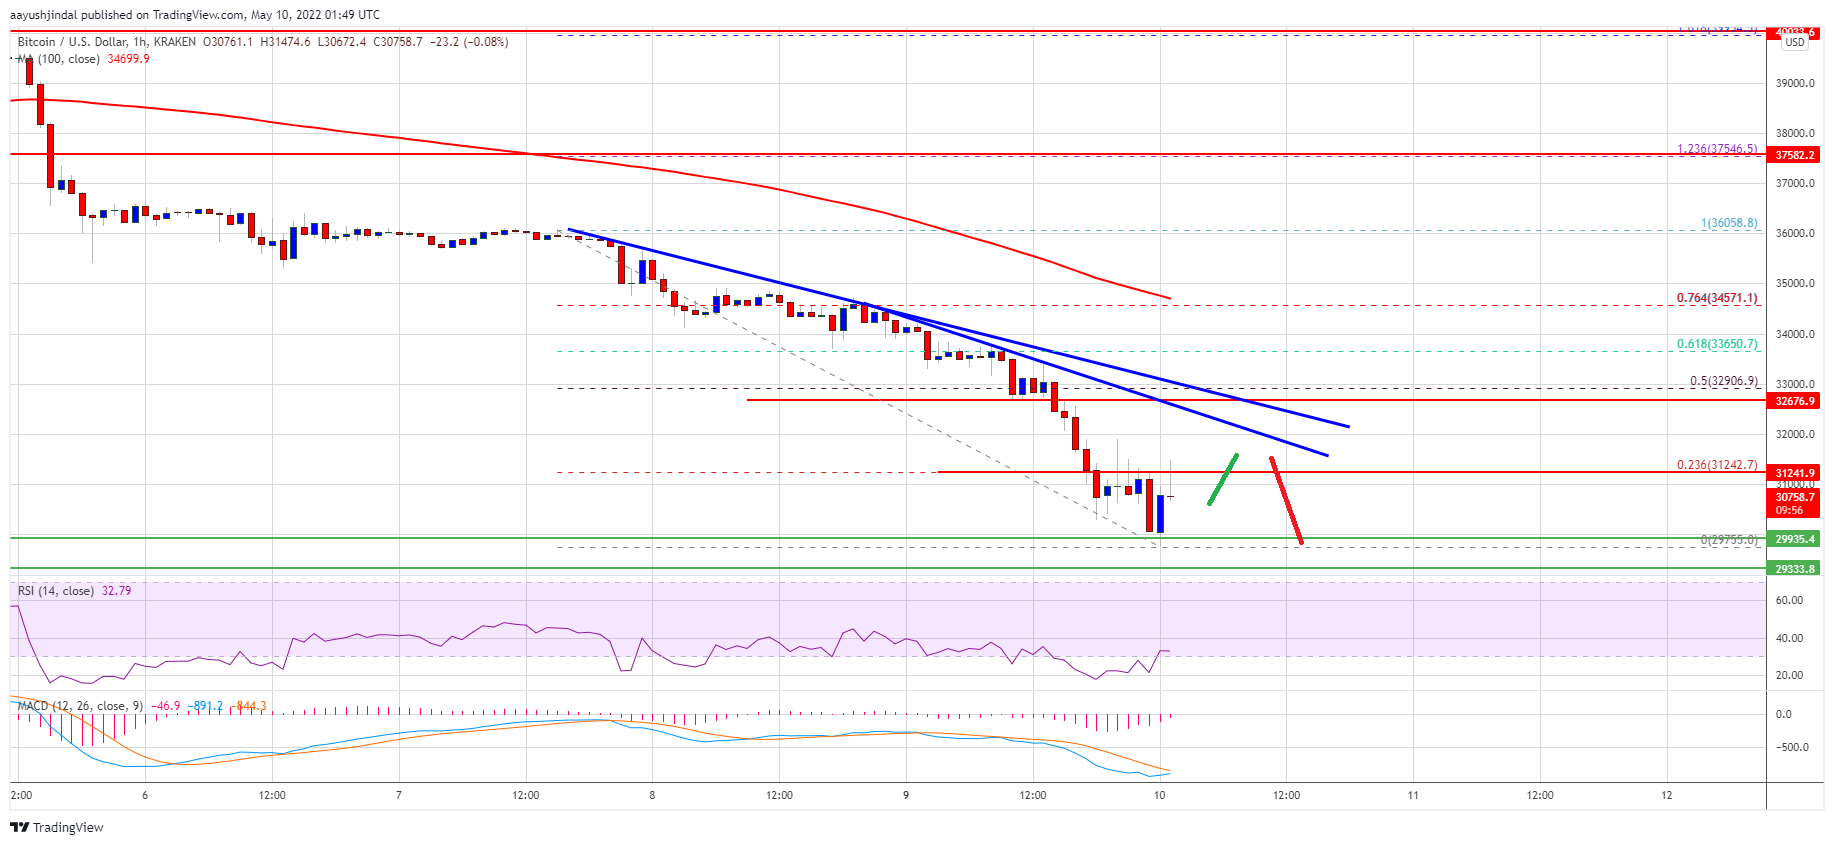
Bitcoin extended losses and even spiked below $30,000 against the US Dollar. BTC is now consolidating and might correct higher towards the $32,000 resistance.
Bitcoin started a strong decline below the $33,500 and $32,000 levels.
The price is now trading below $32,000 and the 100 hourly simple moving average.
There are two important bearish trend lines forming with resistance near $32,000 on the hourly chart of the BTC/USD pair (data feed from Kraken).
The pair might correct higher, but the bears might remain active near $32,000.
Bitcoin Price Declines 10%
Bitcoin price remained in a major downtrend and extended downsides below the $35,000 level. BTC traded below the key $33,500 and $32,000 support levels to move further into a bearish zone.
There was a close below $32,000 and the 100 hourly simple moving average. The price even traded below the $30,800 level and spiked below $30,000. A new multi-week low is forming near $29,755 and the price is now consolidating losses.
On the upside, bitcoin price is facing resistance near the $31,250 level. It is near the 23.6% Fib retracement level of the recent decline from the $36,060 swing high to $29,755 low.
The next key resistance could be near the $32,000 level. There are two important bearish trend lines forming with resistance near $32,000 on the hourly chart of the BTC/USD pair. The key breakout zone could be near the $33,000 zone.
Source: BTCUSD on TradingView.com
The 50% Fib retracement level of the recent decline from the $36,060 swing high to $29,755 low is also near the $33,000 zone. To start a decent recovery wave, the price must settle above the $33,000 level. In the stated case, the price might rise towards the $35,000 level.
More Losses in BTC?
If bitcoin fails to clear the $32,000 resistance zone, it could continue to move down. An immediate support on the downside is near the $30,200 level.
The next major support is seen near the $30,000 level. A downside break and close below the $30,000 support might spark more downsides. The next major support could be $29,500. Any more losses might send the price towards the $28,800 support zone.
Technical indicators:
Hourly MACD – The MACD is now gaining pace in the bearish zone.
Hourly RSI (Relative Strength Index) – The RSI for BTC/USD is now below the 40 level.
Major Support Levels – $30,200, followed by $30,000.
Major Resistance Levels – $31,200, $32,000 and $33,000.
Bitcoin extended losses and even spiked below $30,000 against the US Dollar. BTC is now consolidating and might correct higher towards the $32,000 resistance.
Bitcoin started a strong decline below the $33,500 and $32,000 levels.
The price is now trading below $32,000 and the 100 hourly simple moving average.
There are two important bearish trend lines forming with resistance near $32,000 on the hourly chart of the BTC/USD pair (data feed from Kraken).
The pair might correct higher, but the bears might remain active near $32,000.
Bitcoin price remained in a major downtrend and extended downsides below the $35,000 level. BTC traded below the key $33,500 and $32,000 support levels to move further into a bearish zone.
There was a close below $32,000 and the 100 hourly simple moving average. The price even traded below the $30,800 level and spiked below $30,000. A new multi-week low is forming near $29,755 and the price is now consolidating losses.
On the upside, bitcoin price is facing resistance near the $31,250 level. It is near the 23.6% Fib retracement level of the recent decline from the $36,060 swing high to $29,755 low.
The next key resistance could be near the $32,000 level. There are two important bearish trend lines forming with resistance near $32,000 on the hourly chart of the BTC/USD pair. The key breakout zone could be near the $33,000 zone.
Source: BTCUSD on TradingView.com
The 50% Fib retracement level of the recent decline from the $36,060 swing high to $29,755 low is also near the $33,000 zone. To start a decent recovery wave, the price must settle above the $33,000 level. In the stated case, the price might rise towards the $35,000 level.
If bitcoin fails to clear the $32,000 resistance zone, it could continue to move down. An immediate support on the downside is near the $30,200 level.
The next major support is seen near the $30,000 level. A downside break and close below the $30,000 support might spark more downsides. The next major support could be $29,500. Any more losses might send the price towards the $28,800 support zone.
Technical indicators:
Hourly MACD – The MACD is now gaining pace in the bearish zone.
Hourly RSI (Relative Strength Index) – The RSI for BTC/USD is now below the 40 level.
Major Support Levels – $30,200, followed by $30,000.
Major Resistance Levels – $31,200, $32,000 and $33,000.
Tags: bitcoinbtcusdBTCUSDTxbtusd
FeedzyRead More
Bitcoin and software equities have sharply diverged after moving in lockstep for years, raising questions…
Bitcoin and ether fell Monday after dropping in May, a month that usually sees them…
U.S. spot bitcoin ETFs lost $2.97 billion across 10 trading days through Friday, the longest…
Bitcoin price started a fresh decline below the $73,800 zone. BTC is consolidating and might…
The creator of the Mayer Multiple argues bitcoin’s growing economic substance is compressing volatility and…
Prominent crypto analysis page XWIN Research Japan reports that Bitcoin has reached a new milestone:…