Bitcoin broke the key $28,500 support zone against the US Dollar. BTC is down 10% and might even decline below the $25,000 support zone.
Bitcoin extended its decline below the $28,500 and $26,500 support levels.
The price is now trading below the $28,500 level and the 100 hourly simple moving average.
There is a key bearish trend line forming with resistance near $27,200 on the hourly chart of the BTC/USD pair (data feed from Kraken).
The pair could continue to move down below the $25,000 support zone in the near term.
Bitcoin Price Gains Bearish Momentum
Bitcoin price failed to clear the $30,000 resistance zone. As a result, the bears took over and pushed the price below the key $29,500 and $28,500 support levels.
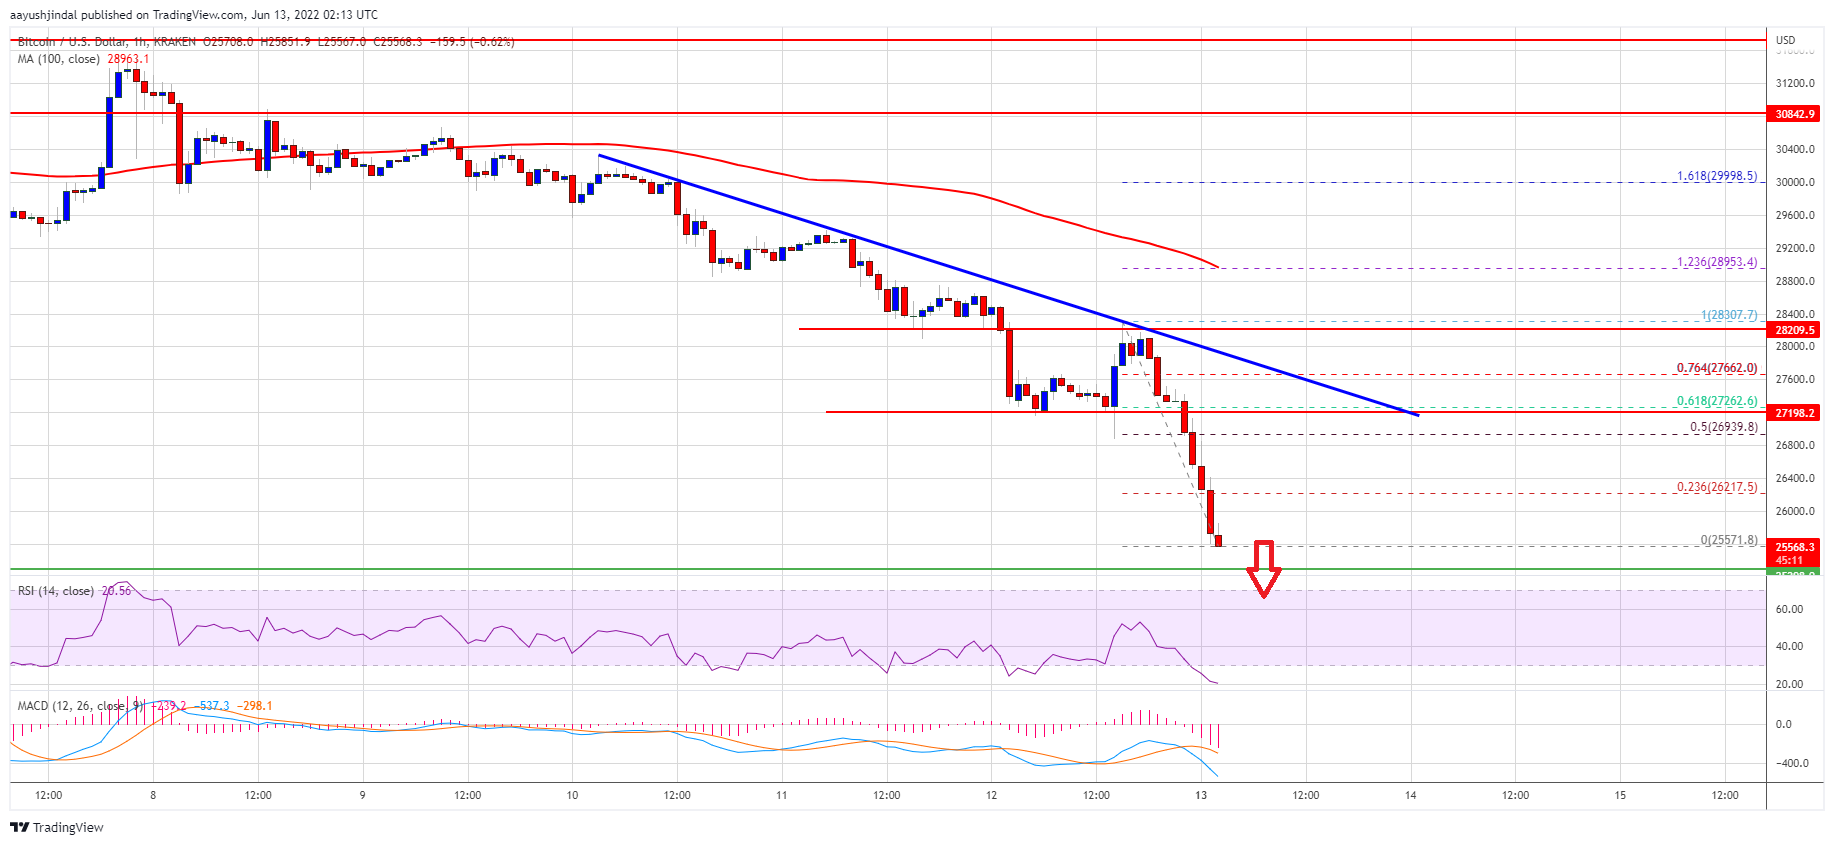
It sparked a major decline below the $28,000 level. The price declined nearly 10% and even broke the $26,500 support level. A new multi-week low is formed near $25,571 and the price is still showing a lot of bearish signs.
Bitcoin is now trading well below the $28,500 level and the 100 hourly simple moving average. There is also a key bearish trend line forming with resistance near $27,200 on the hourly chart of the BTC/USD pair. An immediate resistance on the upside is near the $26,200 level.
It is near the 23.6% Fib retracement level of the recent decline from the $28,307 swing high to $25,571 low. The first major resistance is near the $27,200 level and the bearish trend line.
Source: BTCUSD on TradingView.com
The 50% Fib retracement level of the recent decline from the $28,307 swing high to $25,571 low is also near the trend line resistance. The main resistance is near the $28,500 level. A clear move above the $28,500 resistance level could send the price further higher.
More Losses in BTC?
If bitcoin fails to clear the $27,200 resistance zone, it could continue to move down. An immediate support on the downside is near the $25,500 level.
The next major support is near the $25,000 level. A downside break below the $25,000 support could send the price further lower. In the stated case, the price could drop towards the $23,500 support zone in the near term.
Technical indicators:
Hourly MACD – The MACD is now gaining pace in the bearish zone.
Hourly RSI (Relative Strength Index) – The RSI for BTC/USD is now in the oversold area.
Major Support Levels – $25,500, followed by $25,000.
Major Resistance Levels – $26,200, $27,200 and $28,500.
Bitcoin broke the key $28,500 support zone against the US Dollar. BTC is down 10% and might even decline below the $25,000 support zone.
Bitcoin extended its decline below the $28,500 and $26,500 support levels.
The price is now trading below the $28,500 level and the 100 hourly simple moving average.
There is a key bearish trend line forming with resistance near $27,200 on the hourly chart of the BTC/USD pair (data feed from Kraken).
The pair could continue to move down below the $25,000 support zone in the near term.
Bitcoin price failed to clear the $30,000 resistance zone. As a result, the bears took over and pushed the price below the key $29,500 and $28,500 support levels.
It sparked a major decline below the $28,000 level. The price declined nearly 10% and even broke the $26,500 support level. A new multi-week low is formed near $25,571 and the price is still showing a lot of bearish signs.
Bitcoin is now trading well below the $28,500 level and the 100 hourly simple moving average. There is also a key bearish trend line forming with resistance near $27,200 on the hourly chart of the BTC/USD pair. An immediate resistance on the upside is near the $26,200 level.
It is near the 23.6% Fib retracement level of the recent decline from the $28,307 swing high to $25,571 low. The first major resistance is near the $27,200 level and the bearish trend line.
Source: BTCUSD on TradingView.com
The 50% Fib retracement level of the recent decline from the $28,307 swing high to $25,571 low is also near the trend line resistance. The main resistance is near the $28,500 level. A clear move above the $28,500 resistance level could send the price further higher.
If bitcoin fails to clear the $27,200 resistance zone, it could continue to move down. An immediate support on the downside is near the $25,500 level.
The next major support is near the $25,000 level. A downside break below the $25,000 support could send the price further lower. In the stated case, the price could drop towards the $23,500 support zone in the near term.
Technical indicators:
Hourly MACD – The MACD is now gaining pace in the bearish zone.
Hourly RSI (Relative Strength Index) – The RSI for BTC/USD is now in the oversold area.
Major Support Levels – $25,500, followed by $25,000.
Major Resistance Levels – $26,200, $27,200 and $28,500.
Tags: bitcoinbtcusdBTCUSDTxbtusd
FeedzyRead More
The company sold 4,451 BTC in February to cut debt and fund AI infrastructure pivot.Read…
Your day-ahead look for March 17, 2026Read MoreCoinDesk: Bitcoin, Ethereum, Crypto News and Price Data[#item_full_content]
Crypto markets cooled after Monday's rally, with bitcoin eyeing support near $72,000–$74,000 even as derivatives…
Bitcoin’s foray above $70,000, while encouraging, has not really done much to quell the expectations…
Historical trends point to upside potential, but 2022 parallels and cycle dynamics suggest caution.Read MoreCoinDesk:…
Bitcoin's implied volatility holds steady as panic hedging drives traditional volatility indexes higher.Read MoreCoinDesk: Bitcoin,…