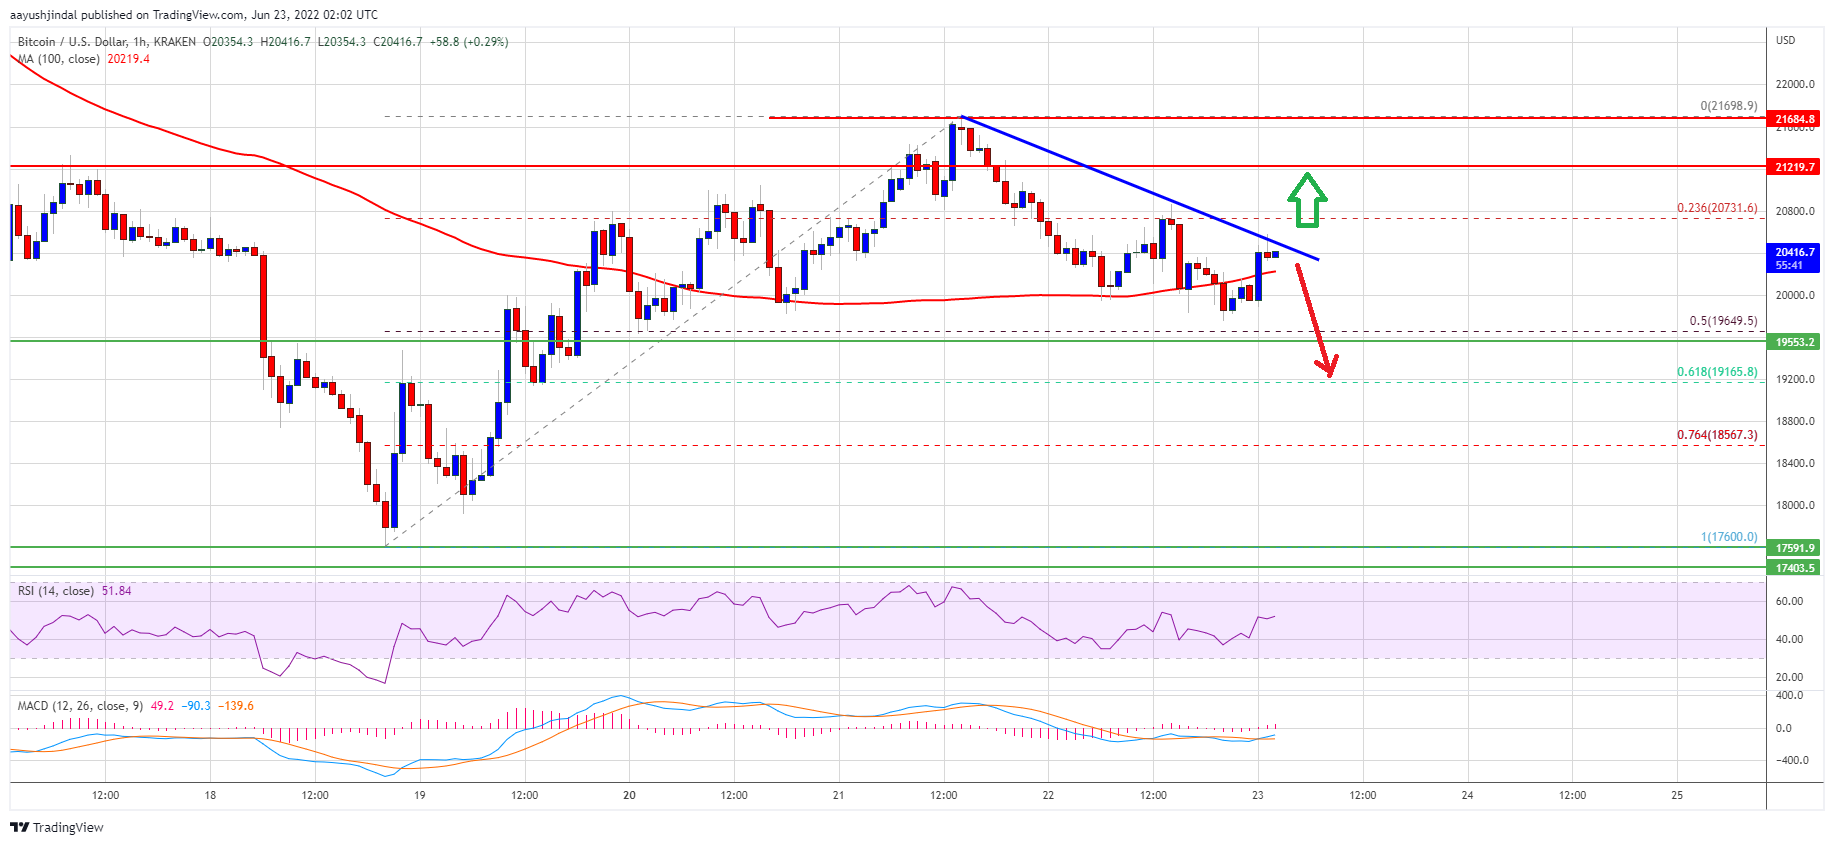
Bitcoin is consolidating above the $20,000 zone against the US Dollar. BTC must clear the $20,800 resistance to restart increase in the near term.
Bitcoin corrected gains and tested the $19,800 support zone.
The price is now above the $20,000 level and the 100 hourly simple moving average.
There is a key bearish trend line forming with resistance near $20,550 on the hourly chart of the BTC/USD pair (data feed from Kraken).
The pair could gain bullish momentum if it clears the $20,550 and $20,800 resistance levels.
Bitcoin Price Faces Resistance
Bitcoin price failed to gain pace above $21,700 and corrected gains. There was a downside correction below the $21,000 support zone.
The price declined below the 23.6% Fib retracement level of the upward move from the $17,600 swing low to $21,700 swing high. The bears even pushed the price below the $20,500 support zone and the 100 hourly simple moving average.
However, the bulls were active above the $19,650 and $19,800 support levels. Bitcoin also stayed above the 50% Fib retracement level of the upward move from the $17,600 swing low to $21,700 swing high.
It is now above the $20,000 level and the 100 hourly simple moving average. An immediate resistance on the upside is near the $20,550 level. There is also a key bearish trend line forming with resistance near $20,550 on the hourly chart of the BTC/USD pair.
Source: BTCUSD on TradingView.com
The first major resistance is near the $20,800 level. A clear move above the $20,800 level might start a decent increase. The next major resistance sits near the $21,220 level, above which the bulls might gain strength for a steady increase.
More Losses in BTC?
If bitcoin fails to clear the $20,800 resistance zone, it could start another decline. An immediate support on the downside is near the $20,200 level and the 100 hourly SMA.
The first major support is near the $20,000 level. The main support is now near the $19,650 level. A downside break below the $19,650 support could restart decline in the near term. In the stated case, the price might slide towards the $18,800 level.
Technical indicators:
Hourly MACD – The MACD is now gaining pace in the bullish zone.
Hourly RSI (Relative Strength Index) – The RSI for BTC/USD is now above the 50 level.
Major Support Levels – $20,000, followed by $19,650.
Major Resistance Levels – $20,800, $21,220 and $21,700.
Bitcoin is consolidating above the $20,000 zone against the US Dollar. BTC must clear the $20,800 resistance to restart increase in the near term.
Bitcoin corrected gains and tested the $19,800 support zone.
The price is now above the $20,000 level and the 100 hourly simple moving average.
There is a key bearish trend line forming with resistance near $20,550 on the hourly chart of the BTC/USD pair (data feed from Kraken).
The pair could gain bullish momentum if it clears the $20,550 and $20,800 resistance levels.
Bitcoin price failed to gain pace above $21,700 and corrected gains. There was a downside correction below the $21,000 support zone.
The price declined below the 23.6% Fib retracement level of the upward move from the $17,600 swing low to $21,700 swing high. The bears even pushed the price below the $20,500 support zone and the 100 hourly simple moving average.
However, the bulls were active above the $19,650 and $19,800 support levels. Bitcoin also stayed above the 50% Fib retracement level of the upward move from the $17,600 swing low to $21,700 swing high.
It is now above the $20,000 level and the 100 hourly simple moving average. An immediate resistance on the upside is near the $20,550 level. There is also a key bearish trend line forming with resistance near $20,550 on the hourly chart of the BTC/USD pair.
Source: BTCUSD on TradingView.com
The first major resistance is near the $20,800 level. A clear move above the $20,800 level might start a decent increase. The next major resistance sits near the $21,220 level, above which the bulls might gain strength for a steady increase.
If bitcoin fails to clear the $20,800 resistance zone, it could start another decline. An immediate support on the downside is near the $20,200 level and the 100 hourly SMA.
The first major support is near the $20,000 level. The main support is now near the $19,650 level. A downside break below the $19,650 support could restart decline in the near term. In the stated case, the price might slide towards the $18,800 level.
Technical indicators:
Hourly MACD – The MACD is now gaining pace in the bullish zone.
Hourly RSI (Relative Strength Index) – The RSI for BTC/USD is now above the 50 level.
Major Support Levels – $20,000, followed by $19,650.
Major Resistance Levels – $20,800, $21,220 and $21,700.
Tags: bitcoinbtcusdBTCUSDTxbtusd
FeedzyRead More
Jiang Zhuoer of BTC.TOP called the week's sell-off speculation overblown, arguing Strategy's small debt and…
Stocks recovered through SpaceX's oversubscribed IPO, an Nvidia and SK Hynix chip pact, and Apple's…
Arca is blaming Strategy's sale of 32 BTC for last week's BTC crash, not AI…
Jiang Zhuoer, CEO of BTCTOP and one of China’s best-known Bitcoin mining figures, pushed back…
Bitcoin price started a recovery wave above the $62,500 zone. BTC is consolidating and might…
Monday’s Bitcoin (BTC) rebound—pushing back above the $63,00 area—has revived a major question: was last…