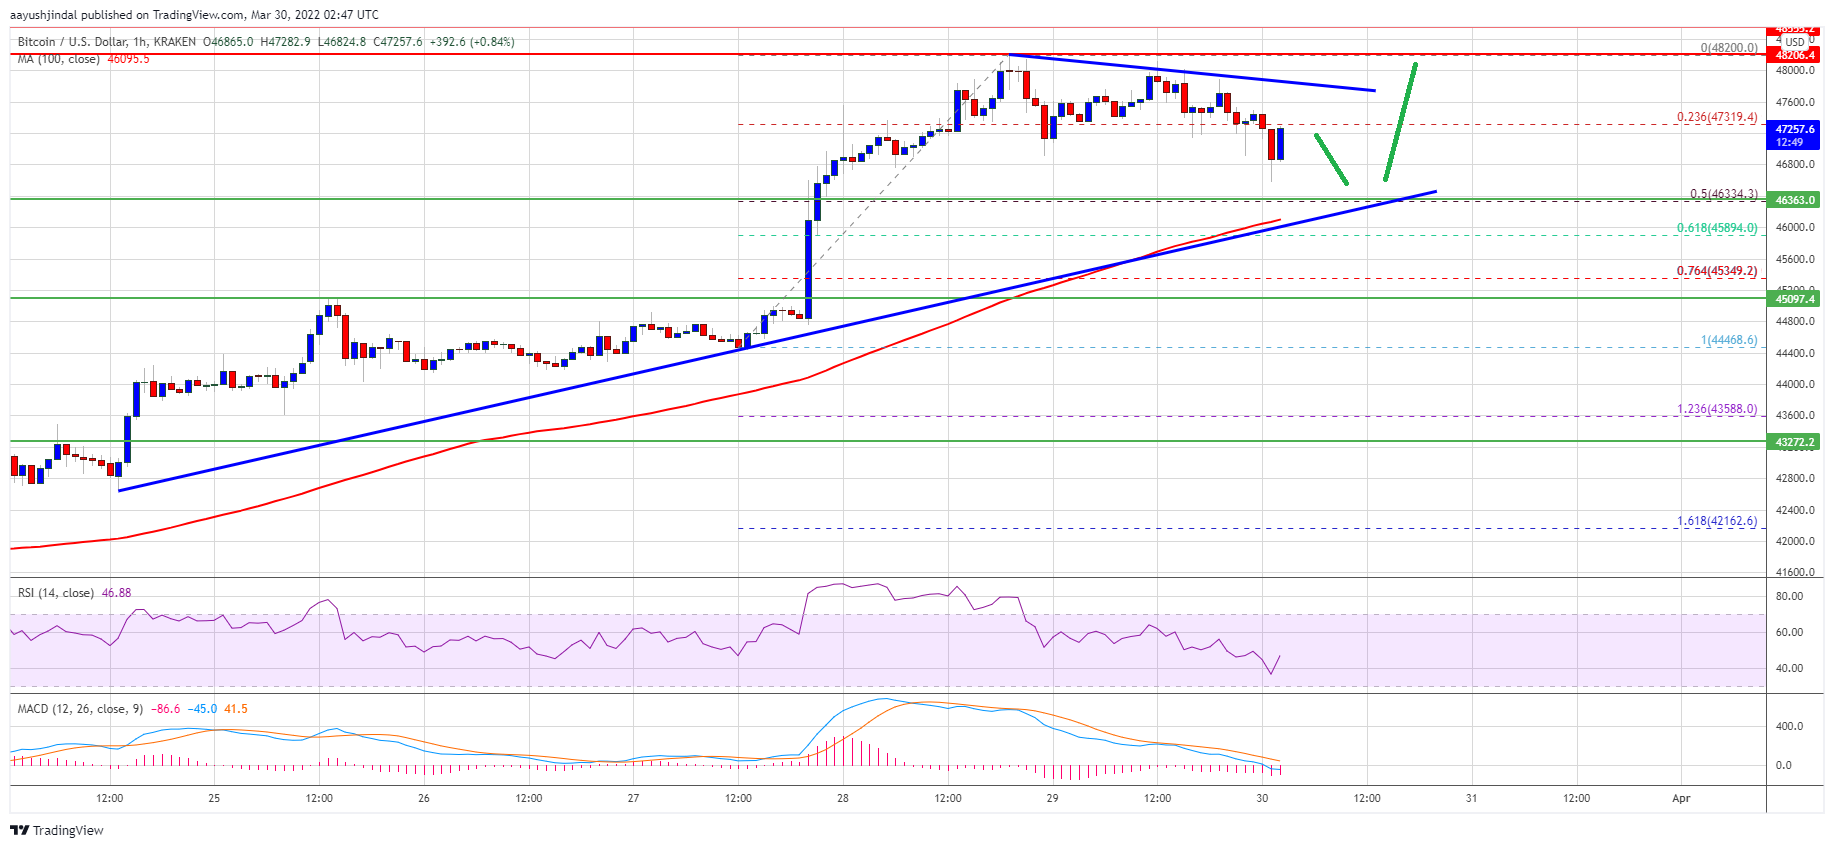
Bitcoin struggled to gain pace above the $48,000 resistance against the US Dollar. BTC is correcting gains, but dips might be limited below $46,000.
Bitcoin gained pace above $47,500 and traded as high as $48,200.
The price is trading above $46,500 and the 100 hourly simple moving average.
There is a key breakout pattern forming with support near $46,300 on the hourly chart of the BTC/USD pair (data feed from Kraken).
The pair could start a fresh increase if it stays above the $46,000 support zone.
Bitcoin Price Remains Supported
Bitcoin price extended increase above the $47,500 resistance zone. BTC even broke the $48,000 resistance zone and traded as high as $48,200.
Recently, there was a downside correction from the $48,200 high. The price declined below the 23.6% Fib retracement level of the upward move from the $44,468 swing low $48,200 high. However, it is still trading above the 100 hourly simple moving average.
There is also a key breakout pattern forming with support near $46,300 on the hourly chart of the BTC/USD pair. On the upside, the price is facing resistance near the $47,600 level.
Source: BTCUSD on TradingView.com
The next major resistance could be near the $47,800 zone and the triangle trend line. A successful break and close above the triangle resistance might push the price towards $48,200. The next major hurdle on the upside might be near the $49,000 level. Any more gains could send the price towards the key the $50,000 level.
Dips Supported in BTC?
If bitcoin fails to clear the $47,800 resistance zone, it could correct further lower. An immediate support on the downside is near the $47,000 zone. The next major support is seen near the $46,800 level. The key support is now forming near the $46,400 level and the triangle trend line. It is near the 50% Fib retracement level of the upward move from the $44,468 swing low $48,200 high.
A downside break below the $46,300 support zone could send the price to $46,000 and the 100 hourly SMA. Any more losses might put a lot of pressure on the bulls in the near term.
Technical indicators:
Hourly MACD – The MACD is slowly gaining pace in the bearish zone.
Hourly RSI (Relative Strength Index) – The RSI for BTC/USD is now just below the 50 level.
Major Support Levels – $46,800, followed by $46,300.
Major Resistance Levels – $47,800, $48,000 and $48,200.
Bitcoin struggled to gain pace above the $48,000 resistance against the US Dollar. BTC is correcting gains, but dips might be limited below $46,000.
Bitcoin gained pace above $47,500 and traded as high as $48,200.
The price is trading above $46,500 and the 100 hourly simple moving average.
There is a key breakout pattern forming with support near $46,300 on the hourly chart of the BTC/USD pair (data feed from Kraken).
The pair could start a fresh increase if it stays above the $46,000 support zone.
Bitcoin price extended increase above the $47,500 resistance zone. BTC even broke the $48,000 resistance zone and traded as high as $48,200.
Recently, there was a downside correction from the $48,200 high. The price declined below the 23.6% Fib retracement level of the upward move from the $44,468 swing low $48,200 high. However, it is still trading above the 100 hourly simple moving average.
There is also a key breakout pattern forming with support near $46,300 on the hourly chart of the BTC/USD pair. On the upside, the price is facing resistance near the $47,600 level.
Source: BTCUSD on TradingView.com
The next major resistance could be near the $47,800 zone and the triangle trend line. A successful break and close above the triangle resistance might push the price towards $48,200. The next major hurdle on the upside might be near the $49,000 level. Any more gains could send the price towards the key the $50,000 level.
If bitcoin fails to clear the $47,800 resistance zone, it could correct further lower. An immediate support on the downside is near the $47,000 zone. The next major support is seen near the $46,800 level. The key support is now forming near the $46,400 level and the triangle trend line. It is near the 50% Fib retracement level of the upward move from the $44,468 swing low $48,200 high.
A downside break below the $46,300 support zone could send the price to $46,000 and the 100 hourly SMA. Any more losses might put a lot of pressure on the bulls in the near term.
Technical indicators:
Hourly MACD – The MACD is slowly gaining pace in the bearish zone.
Hourly RSI (Relative Strength Index) – The RSI for BTC/USD is now just below the 50 level.
Major Support Levels – $46,800, followed by $46,300.
Major Resistance Levels – $47,800, $48,000 and $48,200.
Tags: bitcoinbtcusdBTCUSDTxbtusd
FeedzyRead More
Sudden selloff triggered liquidation-style move, with weak recovery reinforcing bearish structure despite compressed volatility setup.Read…
The Bitcoin price has been one to watch over the past week, jumping by nearly…
U.S. Vice President J.D. Vance said negotiations had ended after a daylong session in Pakistan,…
Dogecoin is flashing renewed signs of weakness as its BTC pair breaks down sharply, dragging…
Arkham data shows 8,285 BTC in Coinbase Prime custody as the company swings from $8…
On-chain data points to easing selling pressure, with realized losses falling and spot markets shifting…