Bitcoin is struggling near the $21,000 resistance zone against the US Dollar. BTC could rally if it clears the $20,900 and $21,000 resistance levels.
Bitcoin is showing a few positive signs above the $20,000 support.
The price is now still above the $20,000 level and the 100 hourly simple moving average.
There is a connecting bullish trend line forming with support near $20,275 on the hourly chart of the BTC/USD pair (data feed from Kraken).
The pair could start a fresh decline if it stays below the key $21,000 resistance zone.
Bitcoin Price Eyes Upside Break
Bitcoin price started an upside correction after it traded as low as $17,600. There was a decent recovery wave above the $18,500 and $19,000 levels.
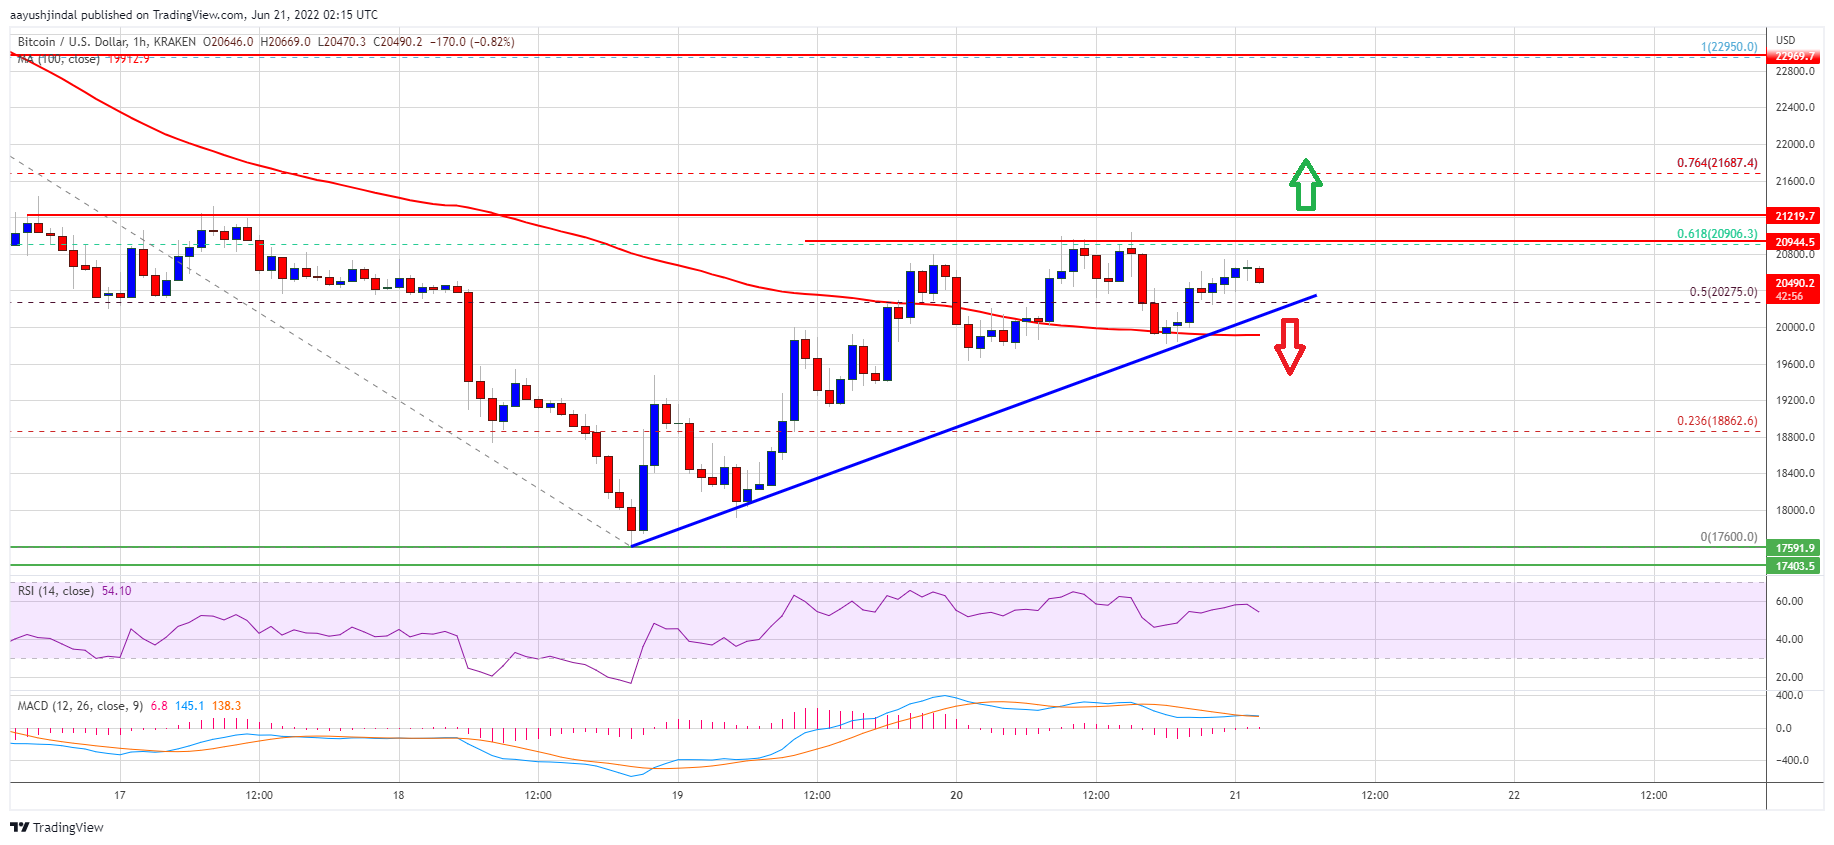
The price surpassed the 50% Fib retracement level of the main drop from the $22,951 high to $17,600 low. The price even cleared the $20,000 level and the 100 hourly simple moving average. There is also a connecting bullish trend line forming with support near $20,275 on the hourly chart of the BTC/USD pair.
However, the bears are now defending major gains above the $20,500 zone. Bitcoin is also struggling near the 61.8% Fib retracement level of the main drop from the $22,951 high to $17,600 low. An immediate resistance on the upside is near the $20,800 level. The first major resistance is near the $20,900 and $21,000 levels.
Source: BTCUSD on TradingView.com
A clear move above the $21,000 level could even push the price towards $21,800. Any more gains might send the price towards the $22,200 level in the coming sessions.
Fresh Decline in BTC?
If bitcoin fails to clear the $21,000 resistance zone, it could start a fresh decline. An immediate support on the downside is near the $20,275 level and the trend line.
The next major support is near the $20,000 level and the 100 hourly SMA. A downside break below the $20,000 support could spark another decline. In the stated case, the price could test $18,800.
Technical indicators:
Hourly MACD – The MACD is now losing pace in the bullish zone.
Hourly RSI (Relative Strength Index) – The RSI for BTC/USD is now above the 50 level.
Major Support Levels – $20,275, followed by $20,000.
Major Resistance Levels – $20,900, $21,000 and $22,000.
Bitcoin is struggling near the $21,000 resistance zone against the US Dollar. BTC could rally if it clears the $20,900 and $21,000 resistance levels.
Bitcoin is showing a few positive signs above the $20,000 support.
The price is now still above the $20,000 level and the 100 hourly simple moving average.
There is a connecting bullish trend line forming with support near $20,275 on the hourly chart of the BTC/USD pair (data feed from Kraken).
The pair could start a fresh decline if it stays below the key $21,000 resistance zone.
Bitcoin price started an upside correction after it traded as low as $17,600. There was a decent recovery wave above the $18,500 and $19,000 levels.
The price surpassed the 50% Fib retracement level of the main drop from the $22,951 high to $17,600 low. The price even cleared the $20,000 level and the 100 hourly simple moving average. There is also a connecting bullish trend line forming with support near $20,275 on the hourly chart of the BTC/USD pair.
However, the bears are now defending major gains above the $20,500 zone. Bitcoin is also struggling near the 61.8% Fib retracement level of the main drop from the $22,951 high to $17,600 low. An immediate resistance on the upside is near the $20,800 level. The first major resistance is near the $20,900 and $21,000 levels.
Source: BTCUSD on TradingView.com
A clear move above the $21,000 level could even push the price towards $21,800. Any more gains might send the price towards the $22,200 level in the coming sessions.
If bitcoin fails to clear the $21,000 resistance zone, it could start a fresh decline. An immediate support on the downside is near the $20,275 level and the trend line.
The next major support is near the $20,000 level and the 100 hourly SMA. A downside break below the $20,000 support could spark another decline. In the stated case, the price could test $18,800.
Technical indicators:
Hourly MACD – The MACD is now losing pace in the bullish zone.
Hourly RSI (Relative Strength Index) – The RSI for BTC/USD is now above the 50 level.
Major Support Levels – $20,275, followed by $20,000.
Major Resistance Levels – $20,900, $21,000 and $22,000.
Tags: bitcoinbtcusdBTCUSDTxbtusd
FeedzyRead More
BIP-110 sought to limit non-financial data on Bitcoin's blockchain but instead reignited debates over censorship…
Your day-ahead look for July 14, 2026Read MoreCoinDesk: Bitcoin, Ethereum, Crypto News and Price Data[#item_full_content]
Bitcoin consolidated after Monday's selloff as Donald Trump threatened more Iran strikes, gold extended its…
Long-term holders are quietly transferring supply to a new generation of buyers, but looming Federal…
Trump reinstated the Hormuz blockade, sending oil higher and rate-hike bets up, reversing the peace…
Coins from the Farace and BTC-e seizures moved through fresh wallets before landing on the…