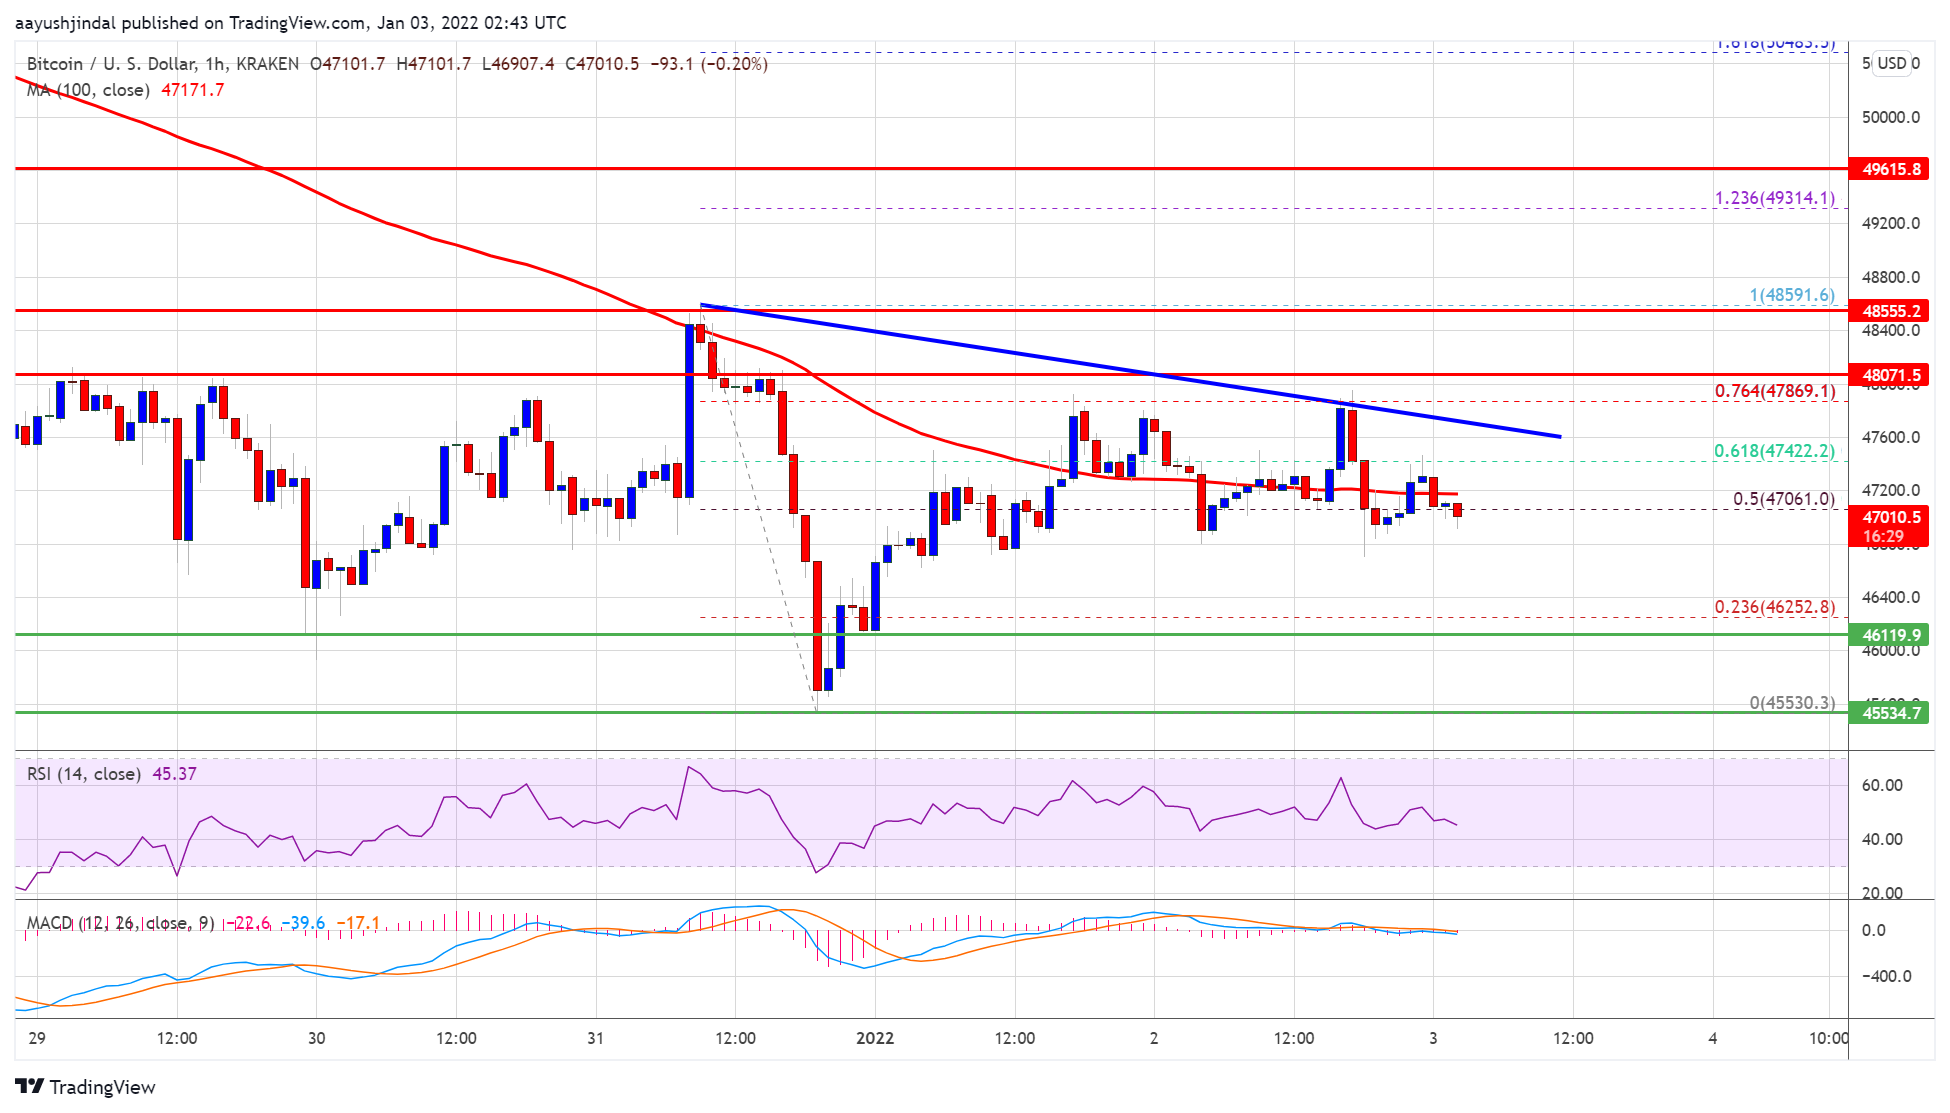
Bitcoin is struggling to recover above the $48,000 resistance against the US Dollar. BTC could decline heavily if there is a clear break below $46,000.
Bitcoin started a consolidation phase below the $48,500 and $48,000 resistance levels.
The price is trading below $48,000 and the 100 hourly simple moving average.
There is a connecting bearish trend line forming with resistance near $47,600 on the hourly chart of the BTC/USD pair (data feed from Kraken).
The pair remains at a risk of a larger decline unless it surges above the $48,000 barrier.
Bitcoin Price Remains At Risk
Bitcoin price failed to recover above $48,500 and started another decline. BTC traded below the $48,000 and $47,500 levels to move into a bearish zone.
The decline gained pace below the $47,000 level and the 100 hourly simple moving average. A low was formed near $45,530 before the price started an upside correction. Bitcoin was able to recover above the $46,500 and $47,000 levels.
The price climbed above the 50% Fib retracement level of the key decline from the $48,591 swing high to $45,530 low. However, the price failed to clear the $48,000 resistance zone.
Besides, there is a connecting bearish trend line forming with resistance near $47,600 on the hourly chart of the BTC/USD pair. The trend line is near the 76.4% Fib retracement level of the key decline from the $48,591 swing high to $45,530 low.
Source: BTCUSD on TradingView.com
A clear move above the $48,000 resistance zone could start a fresh increase. The next major resistance is near the $48,500 level. Any more gains could send the price towards the $50,000 level in the near term.
Fresh Decline In BTC?
If bitcoin fails to recover above $48,000, it could continue to move down. An immediate support is near the $46,400 zone. The first major support is near $46,100.
A downside break below the $46,100 level could push the price towards the $45,500 support. Any more losses may possibly spark a larger decline below the $45,000 support zone. In the stated case, the price may possibly decline towards the $43,200 level.
Technical indicators:
Hourly MACD – The MACD is now gaining pace in the bearish zone.
Hourly RSI (Relative Strength Index) – The RSI for BTC/USD is below the 50 level.
Major Support Levels – $46,100, followed by $45,500.
Major Resistance Levels – $47,500, $48,000 and $48,500.
Bitcoin is struggling to recover above the $48,000 resistance against the US Dollar. BTC could decline heavily if there is a clear break below $46,000.
Bitcoin started a consolidation phase below the $48,500 and $48,000 resistance levels.
The price is trading below $48,000 and the 100 hourly simple moving average.
There is a connecting bearish trend line forming with resistance near $47,600 on the hourly chart of the BTC/USD pair (data feed from Kraken).
The pair remains at a risk of a larger decline unless it surges above the $48,000 barrier.
Bitcoin price failed to recover above $48,500 and started another decline. BTC traded below the $48,000 and $47,500 levels to move into a bearish zone.
The decline gained pace below the $47,000 level and the 100 hourly simple moving average. A low was formed near $45,530 before the price started an upside correction. Bitcoin was able to recover above the $46,500 and $47,000 levels.
The price climbed above the 50% Fib retracement level of the key decline from the $48,591 swing high to $45,530 low. However, the price failed to clear the $48,000 resistance zone.
Besides, there is a connecting bearish trend line forming with resistance near $47,600 on the hourly chart of the BTC/USD pair. The trend line is near the 76.4% Fib retracement level of the key decline from the $48,591 swing high to $45,530 low.
Source: BTCUSD on TradingView.com
A clear move above the $48,000 resistance zone could start a fresh increase. The next major resistance is near the $48,500 level. Any more gains could send the price towards the $50,000 level in the near term.
If bitcoin fails to recover above $48,000, it could continue to move down. An immediate support is near the $46,400 zone. The first major support is near $46,100.
A downside break below the $46,100 level could push the price towards the $45,500 support. Any more losses may possibly spark a larger decline below the $45,000 support zone. In the stated case, the price may possibly decline towards the $43,200 level.
Technical indicators:
Hourly MACD – The MACD is now gaining pace in the bearish zone.
Hourly RSI (Relative Strength Index) – The RSI for BTC/USD is below the 50 level.
Major Support Levels – $46,100, followed by $45,500.
Major Resistance Levels – $47,500, $48,000 and $48,500.
Tags: bitcoinbtcusdBTCUSDTxbtusd
FeedzyRead More
Bitcoin Magazine David Bailey Confirmed As A Bitcoin 2026 Speaker David Bailey has been officially…
Bitcoin Magazine Paraguay Adopts Stricter Crypto Oversight, Mandates Detailed Transaction on Bitcoin Reporting Paraguay’s National…
Bitcoin Magazine Policy Group Calls for Bitcoin Inclusion in Proposed Crypto Tax Exemption The Bitcoin…
Bitcoin Magazine Corporate Bitcoin Holdings Hit Record High as Institutions Accumulate 2.8x Mining Supply: Report…
Research shows that only 8% to 10% of global Bitcoin hashrate runs in oil-sensitive power…
Today’s quantum computers are far from breaking Bitcoin’s cryptography and any real threat would likely…