Bitcoin spiked to test the $45,000 resistance against the US Dollar. BTC is consolidating gains and might correct lower towards $43,000 in the near term.
Bitcoin extended increase and traded close to the $45,000 resistance zone.
The price is trading above $44,000 and the 100 hourly simple moving average.
There is a key contracting triangle forming with resistance near $44,450 on the hourly chart of the BTC/USD pair (data feed from Kraken).
The pair could correct lower if there is a move below the $43,000 support zone.
Bitcoin Price Extends Rally
Bitcoin price started a major increase above the $42,000 level. BTC was able to stay above the $43,000 level and consolidating near $44,000.
Finally, there was another increase and the price climbed above $44,500. The price traded close the $45,000 resistance, where it faced sellers. It is now consolidating gains and there was a minor decline below the $44,500 level.
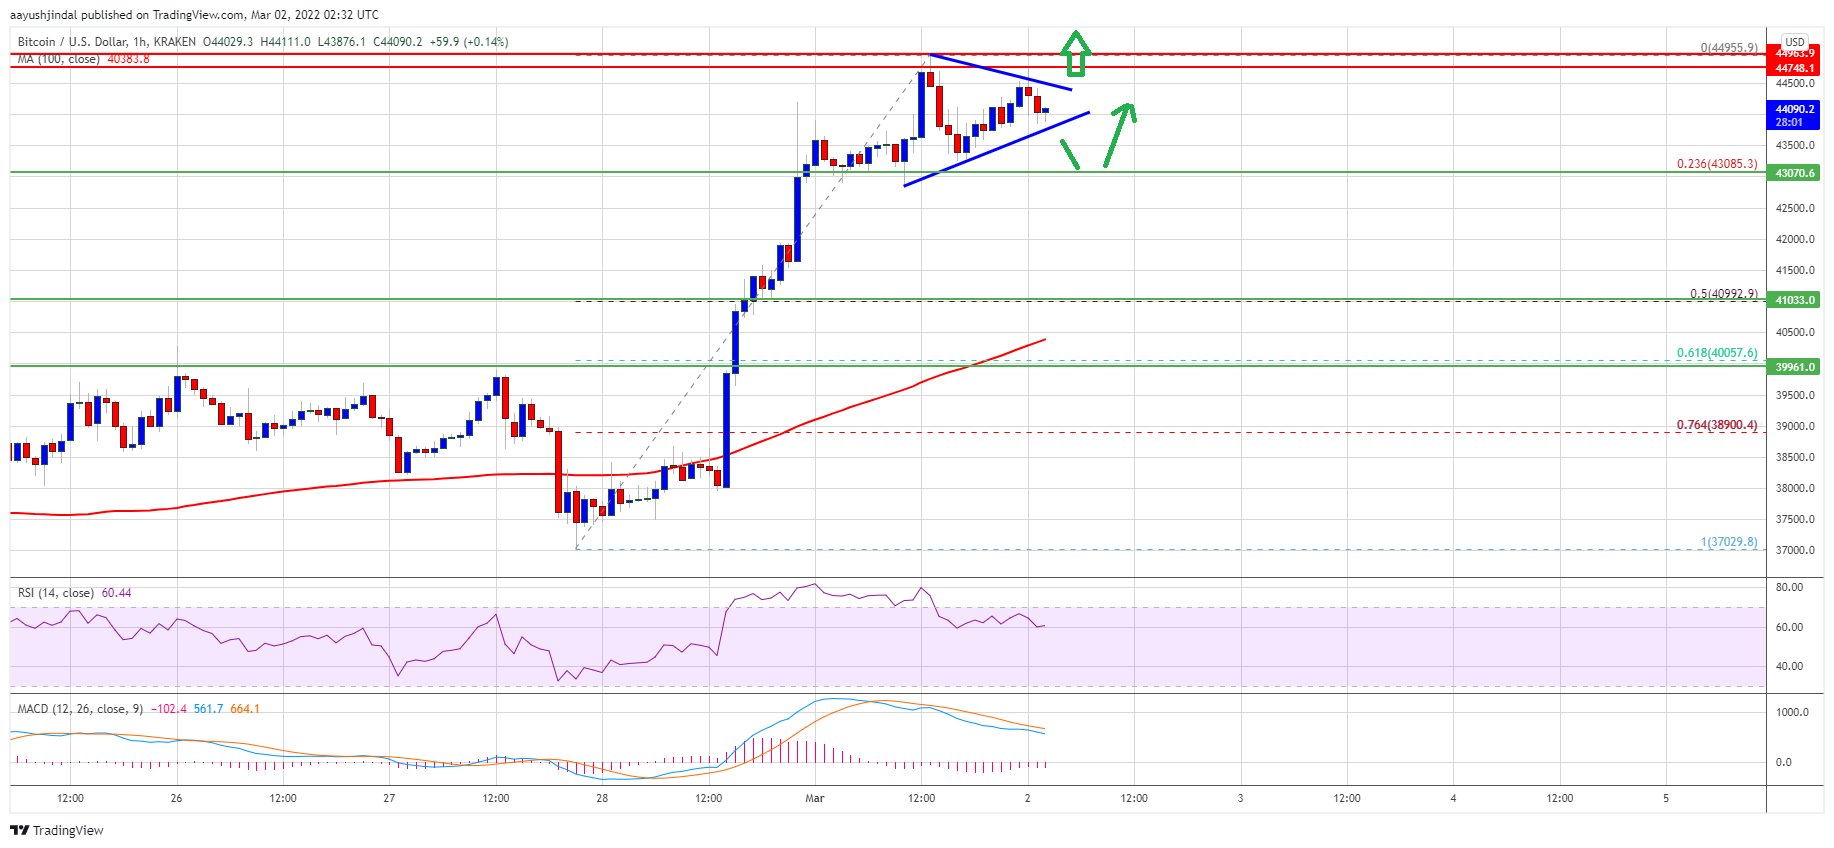
The price is now trading above $44,000 and the 100 hourly simple moving average. It is also well above the 23.6% Fib retracement level of the upward move from the $37,030 swing low to $44,955 high.
There is also a key contracting triangle forming with resistance near $44,450 on the hourly chart of the BTC/USD pair. Bitcoin is now facing resistance is near the $44,200 level. The first key resistance is near the $44,450 level and the triangle upper trend line.
Source: BTCUSD on TradingView.com
The main resistance is now near the $45,000 level. A clear move above the $45,000 resistance could send the price further higher. In the stated case, it could even attempt a clear move above $45,500.
Dips Limited in BTC?
If bitcoin fails to clear the $44,500 resistance zone, it could start a downside correction. An immediate support on the downside is near the $43,800 zone and the triangle lower trend line.
The next major support is seen near the $43,000 level. If there is a downside break below the $43,000 support, the price might gain decline towards $41,000. It is near the 50% Fib retracement level of the upward move from the $37,030 swing low to $44,955 high.
Technical indicators:
Hourly MACD – The MACD is now losing pace in the bullish zone.
Hourly RSI (Relative Strength Index) – The RSI for BTC/USD is still correcting from the overbought zone.
Major Support Levels – $43,800, followed by $43,000.
Major Resistance Levels – $44,200, $44,450 and $45,000.
Bitcoin spiked to test the $45,000 resistance against the US Dollar. BTC is consolidating gains and might correct lower towards $43,000 in the near term.
Bitcoin extended increase and traded close to the $45,000 resistance zone.
The price is trading above $44,000 and the 100 hourly simple moving average.
There is a key contracting triangle forming with resistance near $44,450 on the hourly chart of the BTC/USD pair (data feed from Kraken).
The pair could correct lower if there is a move below the $43,000 support zone.
Bitcoin price started a major increase above the $42,000 level. BTC was able to stay above the $43,000 level and consolidating near $44,000.
Finally, there was another increase and the price climbed above $44,500. The price traded close the $45,000 resistance, where it faced sellers. It is now consolidating gains and there was a minor decline below the $44,500 level.
The price is now trading above $44,000 and the 100 hourly simple moving average. It is also well above the 23.6% Fib retracement level of the upward move from the $37,030 swing low to $44,955 high.
There is also a key contracting triangle forming with resistance near $44,450 on the hourly chart of the BTC/USD pair. Bitcoin is now facing resistance is near the $44,200 level. The first key resistance is near the $44,450 level and the triangle upper trend line.
Source: BTCUSD on TradingView.com
The main resistance is now near the $45,000 level. A clear move above the $45,000 resistance could send the price further higher. In the stated case, it could even attempt a clear move above $45,500.
If bitcoin fails to clear the $44,500 resistance zone, it could start a downside correction. An immediate support on the downside is near the $43,800 zone and the triangle lower trend line.
The next major support is seen near the $43,000 level. If there is a downside break below the $43,000 support, the price might gain decline towards $41,000. It is near the 50% Fib retracement level of the upward move from the $37,030 swing low to $44,955 high.
Technical indicators:
Hourly MACD – The MACD is now losing pace in the bullish zone.
Hourly RSI (Relative Strength Index) – The RSI for BTC/USD is still correcting from the overbought zone.
Major Support Levels – $43,800, followed by $43,000.
Major Resistance Levels – $44,200, $44,450 and $45,000.
Tags: bitcoinbtcusdBTCUSDTxbtusd
FeedzyRead More
At its last stage for government approval, the state's executive council rejected the bond project…
Bitcoin Magazine JPMorgan Says the Real Threat to Bitcoin Isn’t Strategy (MSTR) — It’s Private…
Redemption requests in the $2 trillion private credit market surged to $15.6 billion in the…
Bitcoin Magazine Bitcoin’s New Debt Machine is Facing Its First Major Test Public companies kept…
Compass Point analysts Michael Donovan and Ed Engel said markets are giving little credit to…
Bitcoin Magazine New Hampshire Council Rejects $100 Million Bitcoin-Backed Bond The New Hampshire Executive Council…