Bitcoin started a fresh increase and surpassed $30,000 against the US Dollar. BTC is showing positive signs and might rally further if it clears $30,600.
Bitcoin is gaining pace above the $29,500 and $30,000 resistance levels.
The price is now trading above the $29,500 level and the 100 hourly simple moving average.
There was a break above a major bearish trend line with resistance near $29,200 on the hourly chart of the BTC/USD pair (data feed from Kraken).
The pair could rise further if it clears the $30,600 resistance zone.
Bitcoin Price Gains Pace
Bitcoin price formed a fresh base above the key $28,500 support zone. It remained well bid and started a fresh increase above the $29,200 resistance zone.
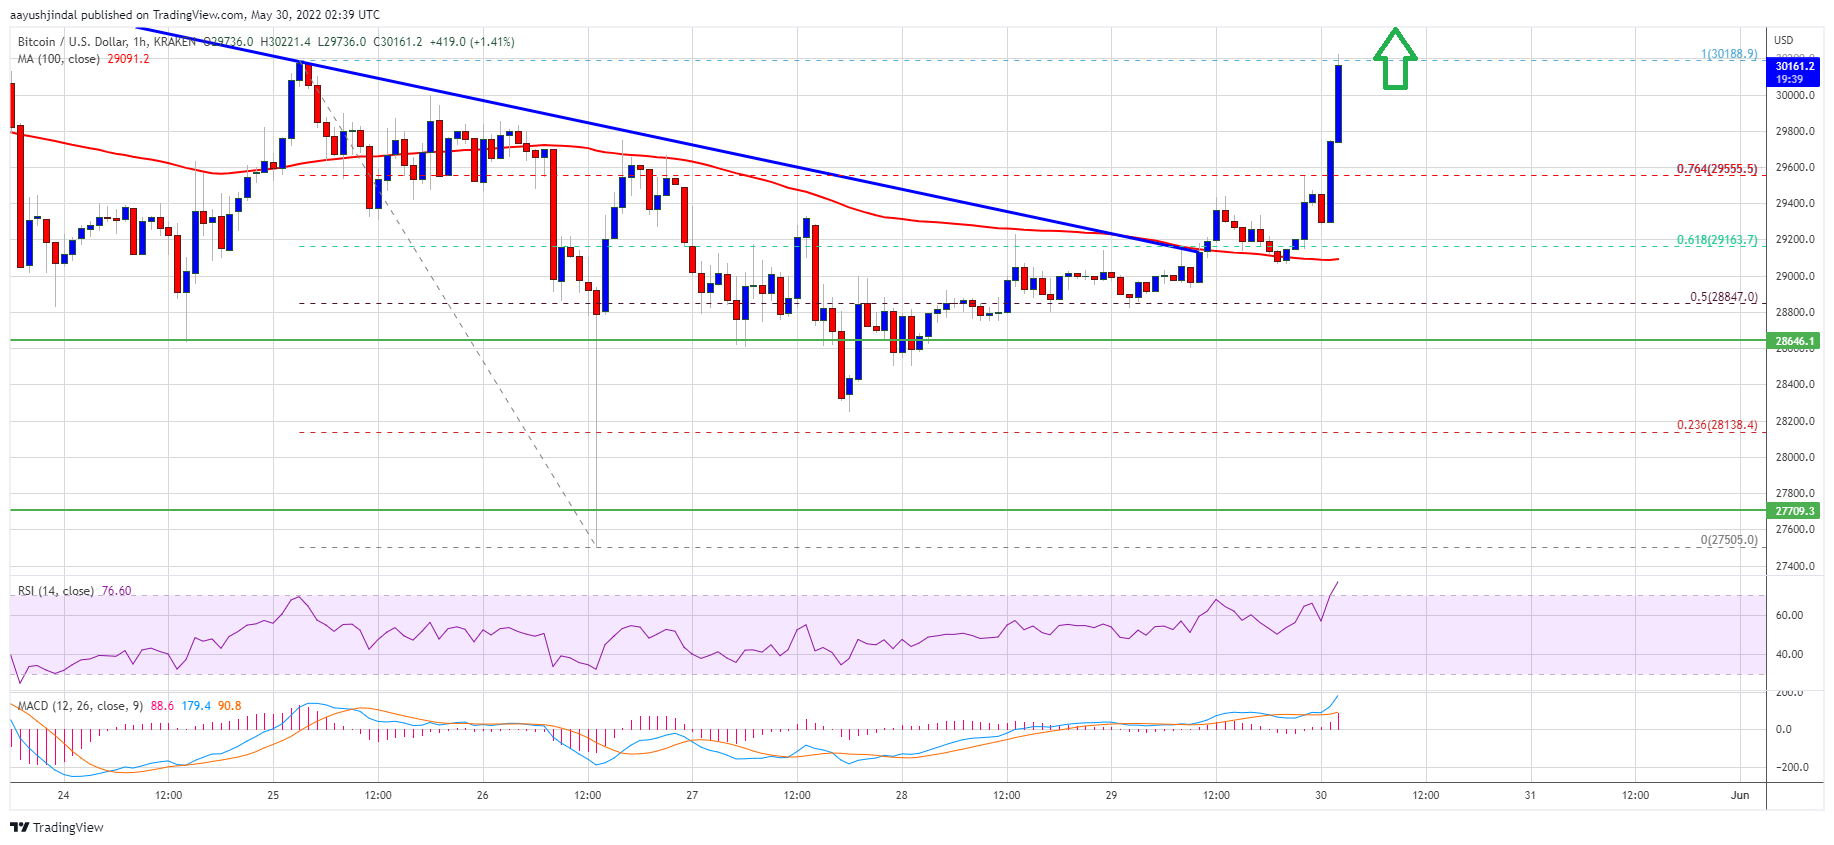
The price cleared the 50% Fib retracement level of the downward move from the $30,188 swing high to $27,505 low. Besides, there was a break above a major bearish trend line with resistance near $29,200 on the hourly chart of the BTC/USD pair.
The pair is now trading above the $29,500 level and the 100 hourly simple moving average. Bitcoin is also trading above the 76.4% Fib retracement level of the downward move from the $30,188 swing high to $27,505 low.
Source: BTCUSD on TradingView.com
An immediate resistance on the upside is near the $30,250 level. The next major resistance is near the $30,600 level. A clear move above the $30,600 resistance level might call for a trend change. In the stated case, the price could even clear the $31,200 resistance. The next major resistance sits near the $32,500 level.
Fresh Decline in BTC?
If bitcoin fails to clear the $30,600 resistance zone, it could start a downside correction. An immediate support on the downside is near the $30,000 level.
The first major support is near the $29,600 level. The main support is now forming near the $29,300 level and the 100 hourly simple moving average. A downside break below the $29,200 support might send the price further lower. In the stated case, the price may perhaps revisit the $28,500 support zone in the near term.
Technical indicators:
Hourly MACD – The MACD is now gaining pace in the bearish zone.
Hourly RSI (Relative Strength Index) – The RSI for BTC/USD is now well above the 60 level.
Major Support Levels – $29,500, followed by $28,500.
Major Resistance Levels – $30,250, $30,600 and $32,500.
Bitcoin started a fresh increase and surpassed $30,000 against the US Dollar. BTC is showing positive signs and might rally further if it clears $30,600.
Bitcoin is gaining pace above the $29,500 and $30,000 resistance levels.
The price is now trading above the $29,500 level and the 100 hourly simple moving average.
There was a break above a major bearish trend line with resistance near $29,200 on the hourly chart of the BTC/USD pair (data feed from Kraken).
The pair could rise further if it clears the $30,600 resistance zone.
Bitcoin price formed a fresh base above the key $28,500 support zone. It remained well bid and started a fresh increase above the $29,200 resistance zone.
The price cleared the 50% Fib retracement level of the downward move from the $30,188 swing high to $27,505 low. Besides, there was a break above a major bearish trend line with resistance near $29,200 on the hourly chart of the BTC/USD pair.
The pair is now trading above the $29,500 level and the 100 hourly simple moving average. Bitcoin is also trading above the 76.4% Fib retracement level of the downward move from the $30,188 swing high to $27,505 low.
Source: BTCUSD on TradingView.com
An immediate resistance on the upside is near the $30,250 level. The next major resistance is near the $30,600 level. A clear move above the $30,600 resistance level might call for a trend change. In the stated case, the price could even clear the $31,200 resistance. The next major resistance sits near the $32,500 level.
If bitcoin fails to clear the $30,600 resistance zone, it could start a downside correction. An immediate support on the downside is near the $30,000 level.
The first major support is near the $29,600 level. The main support is now forming near the $29,300 level and the 100 hourly simple moving average. A downside break below the $29,200 support might send the price further lower. In the stated case, the price may perhaps revisit the $28,500 support zone in the near term.
Technical indicators:
Hourly MACD – The MACD is now gaining pace in the bearish zone.
Hourly RSI (Relative Strength Index) – The RSI for BTC/USD is now well above the 60 level.
Major Support Levels – $29,500, followed by $28,500.
Major Resistance Levels – $30,250, $30,600 and $32,500.
Tags: bitcoinbtcusdBTCUSDTxbtusd
FeedzyRead More
Bitcoin (BTC) made a notable recovery on Friday, witnessing a 4% surge that led the…
More than $246 million in crypto futures positions were wiped out in a single day…
The largest cryptocurrency is up 4.2% on the week despite Friday's reversal, with attention now…
Lekker Capital CIO Quinn Thompson argues on X that collapsing mining economics, combined with a…
A Cambridge study spanning 11 years and 68 verified cable failures found that Bitcoin's physical…
On-chain analytics firm Glassnode has explained how a flip in Bitcoin short-term holder profitability could…