Bitcoin failed to stay above the $46,000 support against the US Dollar. BTC is sliding and might even test the $43,200 support zone.
Bitcoin is down over 4% and there was a move below the $46,000 support.
The price is trading below $45,500 and the 100 hourly simple moving average.
There was a break below a key breakout pattern with support near $46,800 on the hourly chart of the BTC/USD pair (data feed from Kraken).
The pair could extend decline and test the $43,200 support zone in the near term.
Bitcoin Price Dips Below Support
Bitcoin price started a key decline after it struggled to stay above $46,500 and $46,400. BTC declined below the $46,000 support to move into a short-term bearish zone.
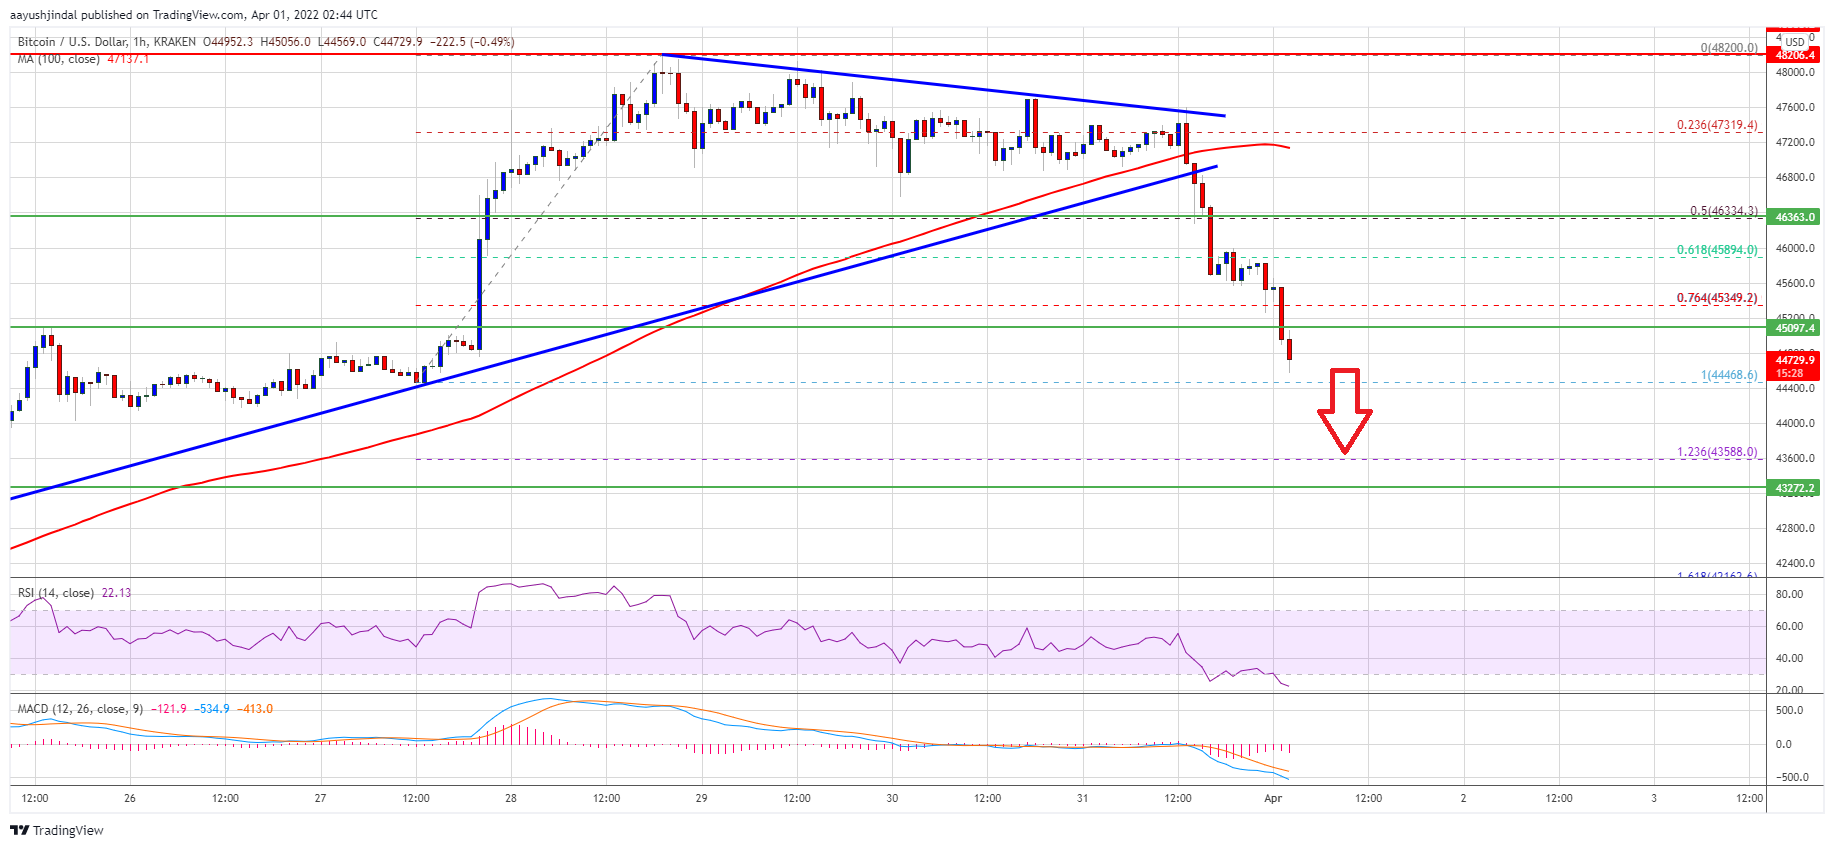
There was a clear move below the 50% Fib retracement level of the upward wave from the $44,470 swing low $48,200 high. The bears were able to push the price below the $45,500 support and the 100 hourly simple moving average.
Besides, there was a break below a key breakout pattern with support near $46,800 on the hourly chart of the BTC/USD pair. Bitcoin is now trading below the 76.4% Fib retracement level of the upward wave from the $44,470 swing low $48,200 high.
Source: BTCUSD on TradingView.com
An immediate support on the downside is near the $44,450 level. The next major support is seen near the $44,000 level. The main support now sits near the $43,320 level. It is near the 1.236 Fib extension level of the upward wave from the $44,470 swing low $48,200 high. A downside break below the $43,320 support zone could send the price to $42,000 in the near term.
Upsides Capped in BTC?
If bitcoin remains stable above the $44,450 support level, it could attempt an upside correction. An immediate resistance on the upside is near the $45,500 level.
The next major resistance is near the $45,800 level. The key hurdle is now forming near the $46,350 level (the previous breakdown zone), above which the price might rise steadily. In the stated case, it could test the $47,200 level and the 100 hourly simple moving average.
Technical indicators:
Hourly MACD – The MACD is slowly gaining pace in the bearish zone.
Hourly RSI (Relative Strength Index) – The RSI for BTC/USD is now in the oversold region.
Major Support Levels – $44,450, followed by $43,320.
Major Resistance Levels – $45,500, $45,800 and $46,350.
Bitcoin failed to stay above the $46,000 support against the US Dollar. BTC is sliding and might even test the $43,200 support zone.
Bitcoin is down over 4% and there was a move below the $46,000 support.
The price is trading below $45,500 and the 100 hourly simple moving average.
There was a break below a key breakout pattern with support near $46,800 on the hourly chart of the BTC/USD pair (data feed from Kraken).
The pair could extend decline and test the $43,200 support zone in the near term.
Bitcoin price started a key decline after it struggled to stay above $46,500 and $46,400. BTC declined below the $46,000 support to move into a short-term bearish zone.
There was a clear move below the 50% Fib retracement level of the upward wave from the $44,470 swing low $48,200 high. The bears were able to push the price below the $45,500 support and the 100 hourly simple moving average.
Besides, there was a break below a key breakout pattern with support near $46,800 on the hourly chart of the BTC/USD pair. Bitcoin is now trading below the 76.4% Fib retracement level of the upward wave from the $44,470 swing low $48,200 high.
Source: BTCUSD on TradingView.com
An immediate support on the downside is near the $44,450 level. The next major support is seen near the $44,000 level. The main support now sits near the $43,320 level. It is near the 1.236 Fib extension level of the upward wave from the $44,470 swing low $48,200 high. A downside break below the $43,320 support zone could send the price to $42,000 in the near term.
If bitcoin remains stable above the $44,450 support level, it could attempt an upside correction. An immediate resistance on the upside is near the $45,500 level.
The next major resistance is near the $45,800 level. The key hurdle is now forming near the $46,350 level (the previous breakdown zone), above which the price might rise steadily. In the stated case, it could test the $47,200 level and the 100 hourly simple moving average.
Technical indicators:
Hourly MACD – The MACD is slowly gaining pace in the bearish zone.
Hourly RSI (Relative Strength Index) – The RSI for BTC/USD is now in the oversold region.
Major Support Levels – $44,450, followed by $43,320.
Major Resistance Levels – $45,500, $45,800 and $46,350.
Tags: bitcoinbtcusdBTCUSDTxbtusd
FeedzyRead More
Bitcoin has experienced another turbulent week marked by sustained downward pressure, reinforcing the broader bearish…
Bitcoin is hovering near key liquidity zones after a week of downward momentum, and traders…
Over the past week, the Bitcoin price kept on putting in consecutive lows, with barely…
Over the past week, the Bitcoin price kept on putting in consecutive lows, with barely…
Despite the price recovery, the Crypto Fear & Greed Index remains in “extreme fear,” indicating…
Michael Saylor’s latest message is blunt and direct: “Go Bitcoin today — the money won’t…