Bitcoin started a fresh decline from well above the $44,000 level against the US Dollar. BTC broke the $42,500 support and remains at a risk of more downsides.
Bitcoin traded below an important support zone at $42,500.
The price is trading below $42,500 and the 100 hourly simple moving average.
There is a key bearish trend line forming with resistance near $42,200 on the hourly chart of the BTC/USD pair (data feed from Kraken).
The pair could decline further if it fails to recover above the $42,800 zone.
Bitcoin Price Extends Decline
Bitcoin price failed to clear the $45,500 resistance and started a major decline. BTC traded below the $43,200 and USD 42,500 support levels to move into a short-term bearish zone.
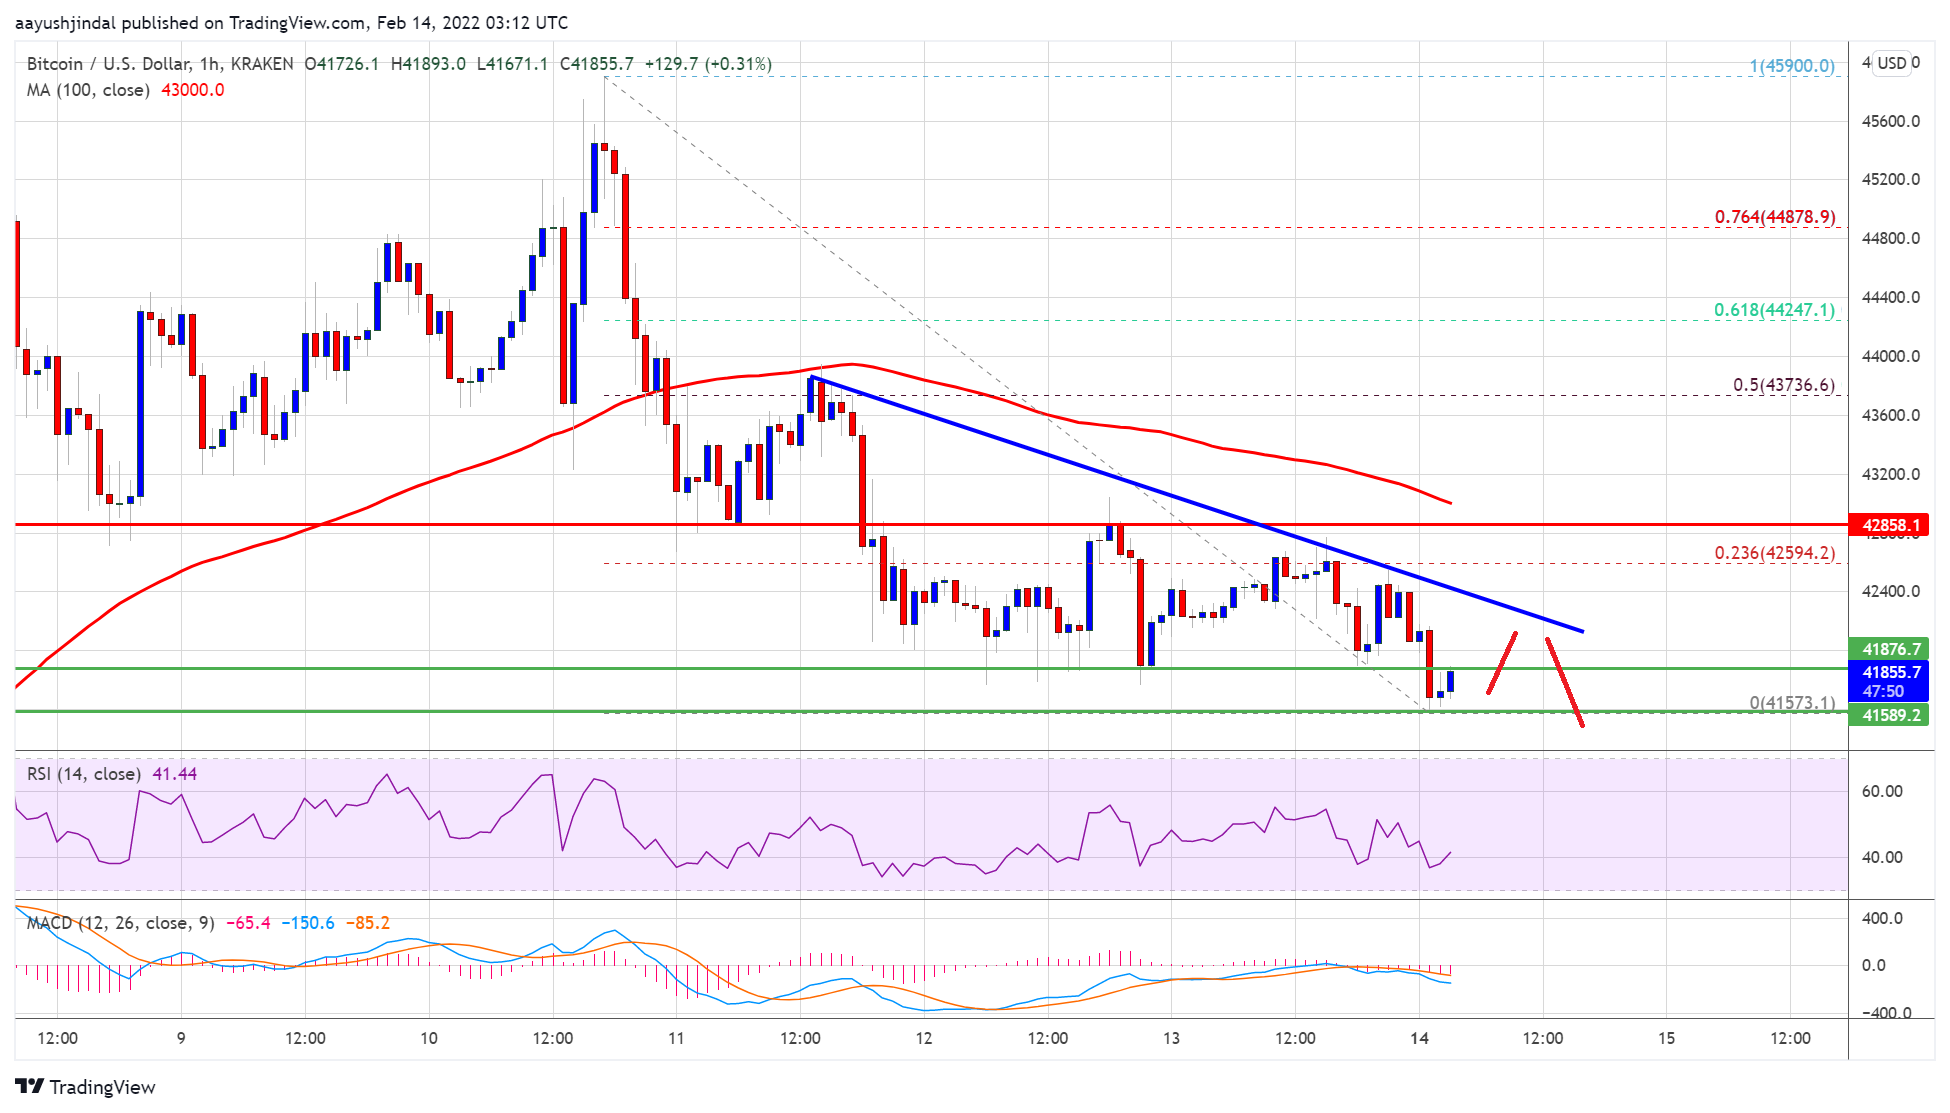
There was also a close below the $42,50 level and the 100 hourly simple moving average. A low was formed near $41,573 and the price is now consolidating losses. An immediate resistance is near the $42,000 level. The first major resistance is near the $42,200 level.
Besides, there is also a key bearish trend line forming with resistance near $42,200 on the hourly chart of the BTC/USD pair. The next key resistance could be $42,500 or the 23.6% Fib retracement level of the recent decline from the $45,900 high to $41,573 low.
Source: BTCUSD on TradingView.com
The main resistance seems to be forming near the $42,850 level or the 100 hourly simple moving average. A clear move above the 100 hourly simple moving average might send the price to $43,750. It is near the 50% Fib retracement level of the recent decline from the $45,900 high to $41,573 low.
More Losses in BTC?
If bitcoin fails to start a fresh increase above $42,850, it could continue to move down. An immediate support on the downside is near the $41,600 zone.
The next major support is seen near the $41,200 level. If there is a downside break below the $41,200 support, the price could start a major decline towards the $40,000 level.
Technical indicators:
Hourly MACD – The MACD is now gaining pace in the bearish zone.
Hourly RSI (Relative Strength Index) – The RSI for BTC/USD is now below the 50 level.
Major Support Levels – $41,600, followed by $41,200.
Major Resistance Levels – $42,200, $42,850 and $43,000.
Bitcoin started a fresh decline from well above the $44,000 level against the US Dollar. BTC broke the $42,500 support and remains at a risk of more downsides.
Bitcoin traded below an important support zone at $42,500.
The price is trading below $42,500 and the 100 hourly simple moving average.
There is a key bearish trend line forming with resistance near $42,200 on the hourly chart of the BTC/USD pair (data feed from Kraken).
The pair could decline further if it fails to recover above the $42,800 zone.
Bitcoin price failed to clear the $45,500 resistance and started a major decline. BTC traded below the $43,200 and USD 42,500 support levels to move into a short-term bearish zone.
There was also a close below the $42,50 level and the 100 hourly simple moving average. A low was formed near $41,573 and the price is now consolidating losses. An immediate resistance is near the $42,000 level. The first major resistance is near the $42,200 level.
Besides, there is also a key bearish trend line forming with resistance near $42,200 on the hourly chart of the BTC/USD pair. The next key resistance could be $42,500 or the 23.6% Fib retracement level of the recent decline from the $45,900 high to $41,573 low.
Source: BTCUSD on TradingView.com
The main resistance seems to be forming near the $42,850 level or the 100 hourly simple moving average. A clear move above the 100 hourly simple moving average might send the price to $43,750. It is near the 50% Fib retracement level of the recent decline from the $45,900 high to $41,573 low.
If bitcoin fails to start a fresh increase above $42,850, it could continue to move down. An immediate support on the downside is near the $41,600 zone.
The next major support is seen near the $41,200 level. If there is a downside break below the $41,200 support, the price could start a major decline towards the $40,000 level.
Technical indicators:
Hourly MACD – The MACD is now gaining pace in the bearish zone.
Hourly RSI (Relative Strength Index) – The RSI for BTC/USD is now below the 50 level.
Major Support Levels – $41,600, followed by $41,200.
Major Resistance Levels – $42,200, $42,850 and $43,000.
Tags: bitcoinbtcusdBTCUSDTxbtusd
FeedzyRead More
Bitcoin’s recovery attempts are still being judged against a larger structure that has controlled price…
Bitcoin Magazine CME Group Goes Live With 24/7 Crypto Futures and Options, Launches Bitcoin Volatility…
Bitcoin is still trading above $60,000, but there are questions as to whether that area…
Michael Saylor's Strategy has evolved into a far more complex bitcoin-finance machine since it last…
With Strategy breaking its accumulation streak and many peers stepping aside, the list of active…
Bitcoin is approaching a pivotal moment, with several key support and resistance levels set to…