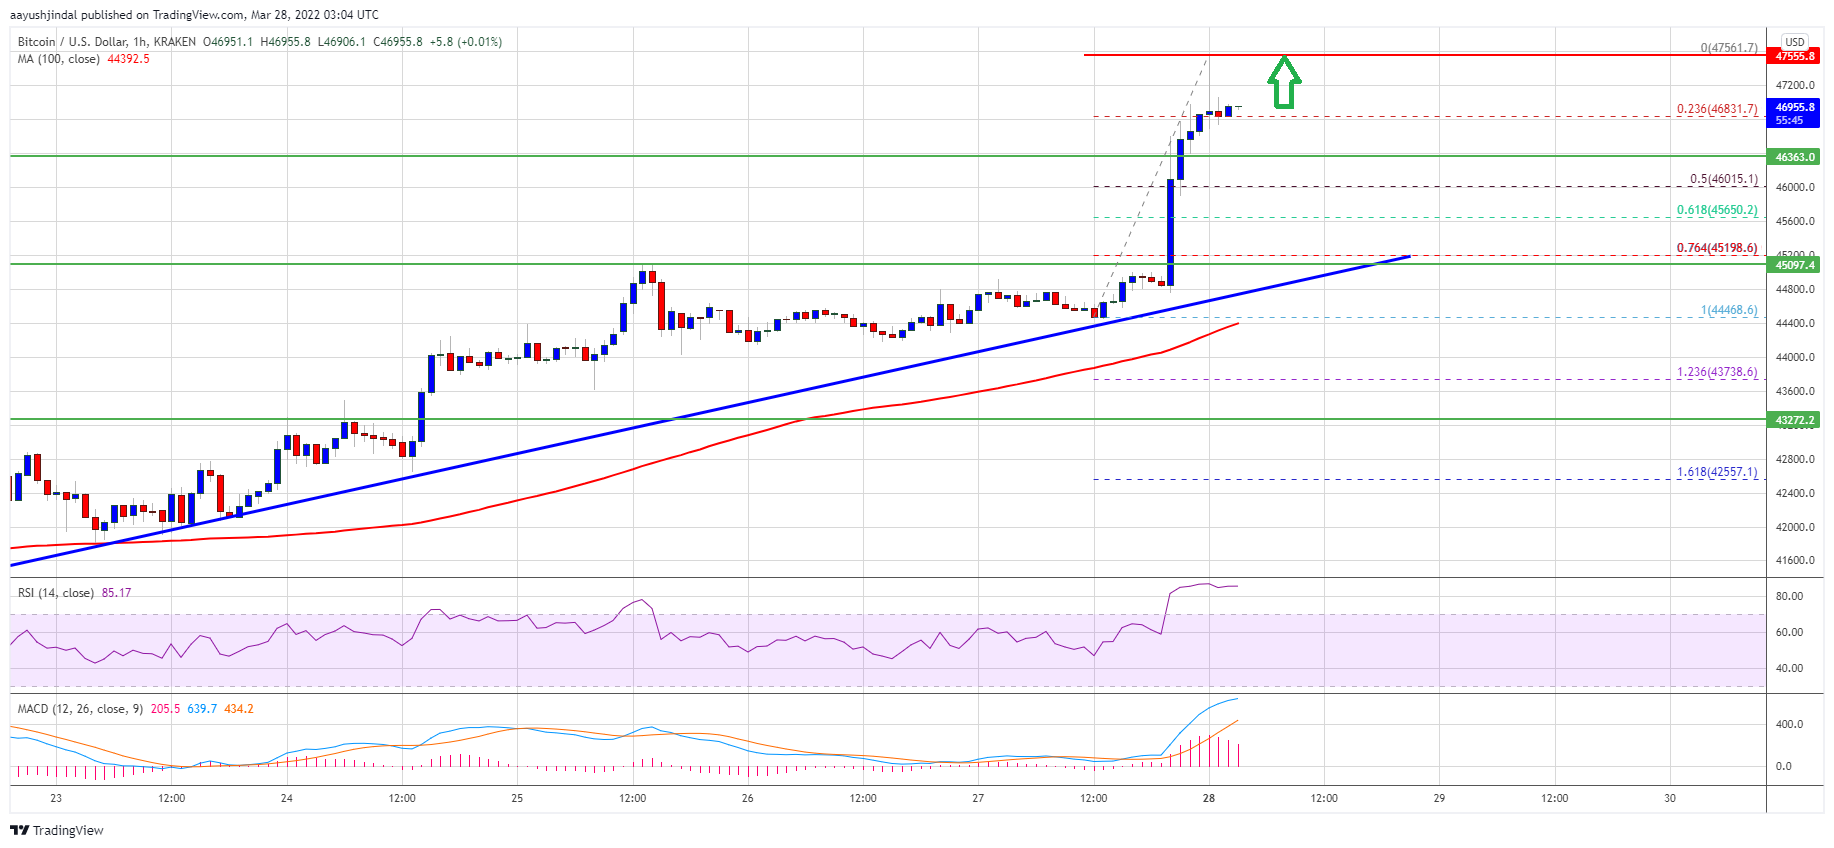
Bitcoin started a fresh increase above the $45,000 resistance against the US Dollar. BTC even broke $47,000 and is showing positive signs.
Bitcoin started a fresh increase after it broke the $45,000 resistance zone.
The price is trading above $45,500 and the 100 hourly simple moving average.
There is a major bullish trend line forming with support near $45,200 on the hourly chart of the BTC/USD pair (data feed from Kraken).
The pair could continue to rise and might even clear the $48,000 resistance zone.
Bitcoin Price Rallies 5%
Bitcoin price formed a support base above the $43,500 level. BTC started a fresh increase and was able to clear the key $45,000 resistance zone.
It opened the doors for more upsides above the $46,500 level. The price even jumped above the $47,000 level and settled above the 100 hourly simple moving average. A high was formed near $47,561 and the price is now consolidating gains.
Bitcoin tested the 23.6% Fib retracement level of the recent rally from the $44,468 swing low to $47,561 high. Besides, there is a major bullish trend line forming with support near $45,200 on the hourly chart of the BTC/USD pair.
On the upside, the price is facing resistance near the $47,200 level. The next major resistance could be near the $47,500 zone. A successful break and close above the $47,600 level might spark another increase. In the stated case, the price might even clear the $48,000 resistance level.
Source: BTCUSD on TradingView.com
The next major resistance could be near the $49,200 level. Any more gains could open the doors for a move towards the $50,000 level.
Dips Supported in BTC?
If bitcoin fails to clear the $47,500 resistance zone, it could start a downside correction. An immediate support on the downside is near the $46,800 zone.
The next major support is seen near the $46,350 level. The main support is near the $46,000 level or the 50% Fib retracement level of the recent rally from the $44,468 swing low to $47,561 high. A downside break below the $46,000 support zone could start a drop towards the $45,0s00 support.
Technical indicators:
Hourly MACD – The MACD is slowly losing pace in the bullish zone.
Hourly RSI (Relative Strength Index) – The RSI for BTC/USD is now in the overbought zone.
Major Support Levels – $46,000, followed by $45,000.
Major Resistance Levels – $47,200, $47,500 and $50,000.
Bitcoin started a fresh increase above the $45,000 resistance against the US Dollar. BTC even broke $47,000 and is showing positive signs.
Bitcoin started a fresh increase after it broke the $45,000 resistance zone.
The price is trading above $45,500 and the 100 hourly simple moving average.
There is a major bullish trend line forming with support near $45,200 on the hourly chart of the BTC/USD pair (data feed from Kraken).
The pair could continue to rise and might even clear the $48,000 resistance zone.
Bitcoin price formed a support base above the $43,500 level. BTC started a fresh increase and was able to clear the key $45,000 resistance zone.
It opened the doors for more upsides above the $46,500 level. The price even jumped above the $47,000 level and settled above the 100 hourly simple moving average. A high was formed near $47,561 and the price is now consolidating gains.
Bitcoin tested the 23.6% Fib retracement level of the recent rally from the $44,468 swing low to $47,561 high. Besides, there is a major bullish trend line forming with support near $45,200 on the hourly chart of the BTC/USD pair.
On the upside, the price is facing resistance near the $47,200 level. The next major resistance could be near the $47,500 zone. A successful break and close above the $47,600 level might spark another increase. In the stated case, the price might even clear the $48,000 resistance level.
Source: BTCUSD on TradingView.com
The next major resistance could be near the $49,200 level. Any more gains could open the doors for a move towards the $50,000 level.
If bitcoin fails to clear the $47,500 resistance zone, it could start a downside correction. An immediate support on the downside is near the $46,800 zone.
The next major support is seen near the $46,350 level. The main support is near the $46,000 level or the 50% Fib retracement level of the recent rally from the $44,468 swing low to $47,561 high. A downside break below the $46,000 support zone could start a drop towards the $45,0s00 support.
Technical indicators:
Hourly MACD – The MACD is slowly losing pace in the bullish zone.
Hourly RSI (Relative Strength Index) – The RSI for BTC/USD is now in the overbought zone.
Major Support Levels – $46,000, followed by $45,000.
Major Resistance Levels – $47,200, $47,500 and $50,000.
Tags: bitcoinbtcusdBTCUSDTxbtusd
FeedzyRead More
A tiny Strategy sale raised a bigger question about Saylor’s never-sell stance, while easing Iran…
TL;DR Aave Labs has proposed onboarding Circle Wrapped Bitcoin, or cirBTC, to Aave V3 Core…
Bitcoin Magazine Standard Chartered Calls Crypto Bottom as Bitcoin Price Recovers From $59,000 Low Standard…
Senior market analyst Geoffrey Kendrick pointed to the SpaceX IPO and a potential U.S.-Iran peace…
Bitcoin ETF investors have pulled billions this year, but the broader crypto ETF market remains…
Bitcoin Magazine SpaceX Officially Joins Public Bitcoin Leaderboard as 8th Largest Holder With 18,712 BTC…