Bitcoin extended decline below the $40,000 support against the US Dollar. BTC is correcting losses, but it might face resistance near the $39,500 zone.
Bitcoin extended decline below the $40,000 and $39,500 support levels.
The price is trading below $40,000 and the 100 hourly simple moving average.
There is a key bearish trend line forming with resistance near $39,500 on the hourly chart of the BTC/USD pair (data feed from Kraken).
The pair could correct higher, but upsides might be limited above $40,000.
Bitcoin Price Remains In Downtrend
Bitcoin price failed to stay above the $42,000 support level and extended decline. BTC traded below the $41,200 support level to enter a bearish zone.
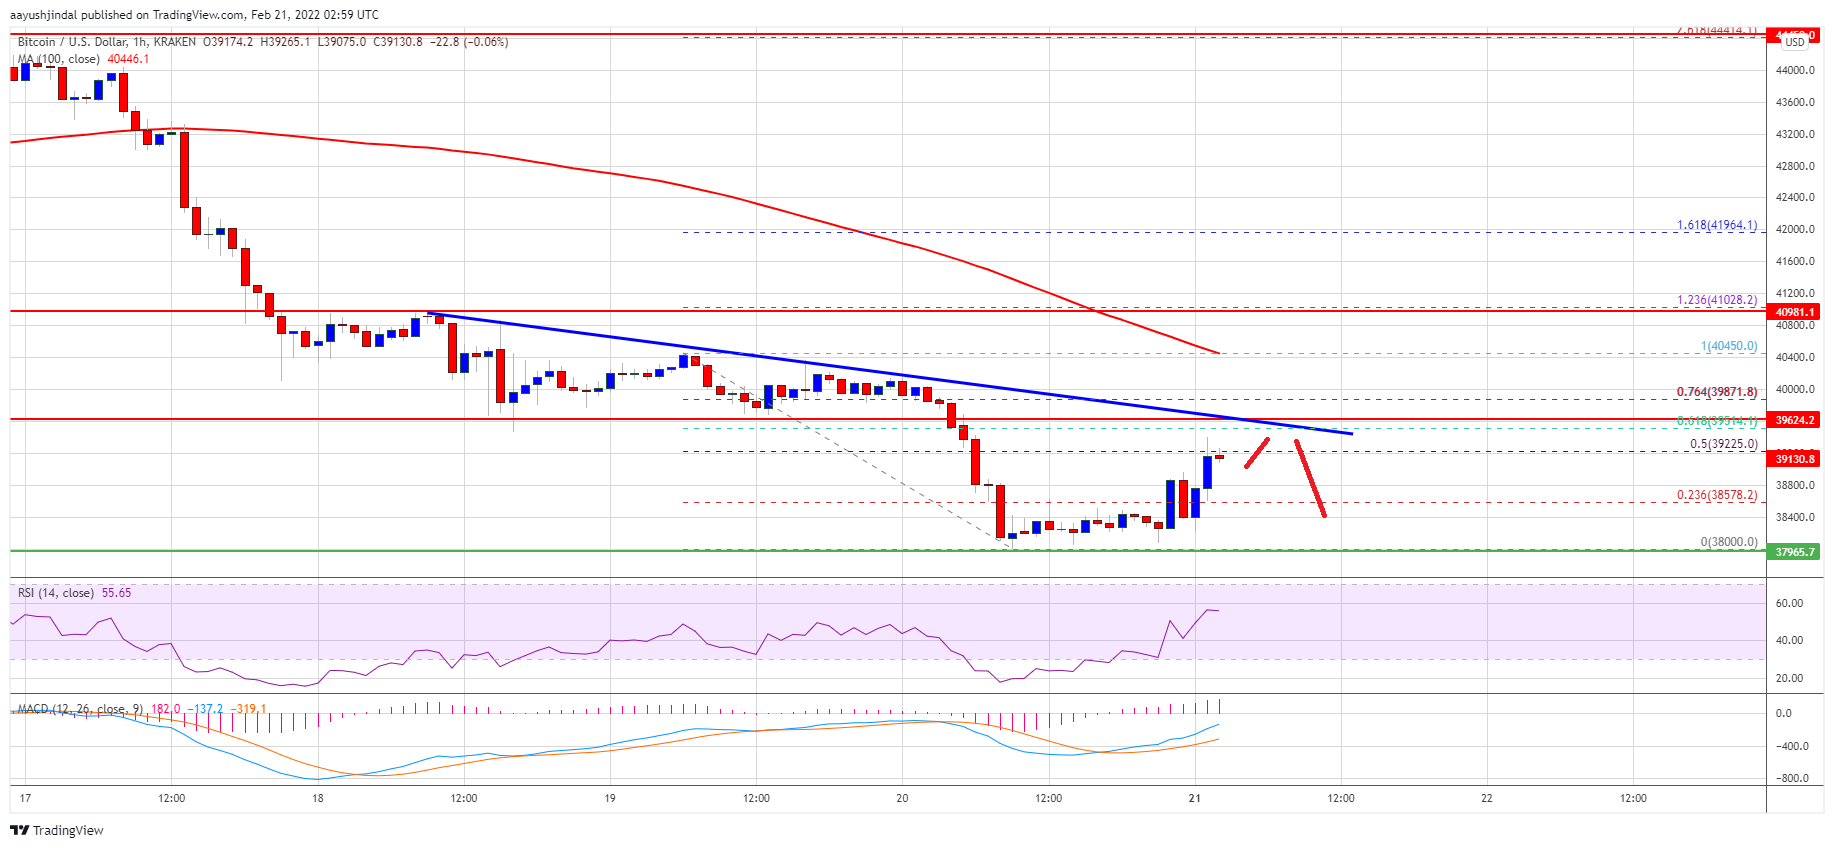
The decline gained pace below the $40,000 level and the 100 hourly simple moving average. The pair even broke the $39,500 support and traded as low as $38,000. It is now correcting losses and trading above the $38,800 level.
Bitcoin is now testing the 50% Fib retracement level of the recent decline from the $40,450 swing high to $38,000 low. On the upside, an initial resistance is near the $29,300. The next key resistance is near the $39,500 level. There is also a key bearish trend line forming with resistance near $39,500 on the hourly chart of the BTC/USD pair.
The trend line is close to the 61.8% Fib retracement level of the recent decline from the $40,450 swing high to $38,000 low. The main resistance is now forming near the $40,000 level.
Source: BTCUSD on TradingView.com
A clear move above the $40,000 resistance zone might start a decent increase. The next major resistance is near $40,450 and the 100 hourly simple moving average, above which the price might rise towards the $41,200 level.
More Losses in BTC?
If bitcoin fails to start a recovery wave above the $39,500 resistance zone, it could continue to move down. An immediate support on the downside is near the $38,500 zone.
The next major support is seen near the $38,000 level. If there is a downside break below the $38,000 support zone, the price might gain bearish momentum for a move to $36,800.
Technical indicators:
Hourly MACD – The MACD is now losing pace in the bullish zone.
Hourly RSI (Relative Strength Index) – The RSI for BTC/USD is just above the 50 level.
Major Support Levels – $38,500, followed by $38,000.
Major Resistance Levels – $39,500, $40,000 and $40,450.
Bitcoin extended decline below the $40,000 support against the US Dollar. BTC is correcting losses, but it might face resistance near the $39,500 zone.
Bitcoin extended decline below the $40,000 and $39,500 support levels.
The price is trading below $40,000 and the 100 hourly simple moving average.
There is a key bearish trend line forming with resistance near $39,500 on the hourly chart of the BTC/USD pair (data feed from Kraken).
The pair could correct higher, but upsides might be limited above $40,000.
Bitcoin price failed to stay above the $42,000 support level and extended decline. BTC traded below the $41,200 support level to enter a bearish zone.
The decline gained pace below the $40,000 level and the 100 hourly simple moving average. The pair even broke the $39,500 support and traded as low as $38,000. It is now correcting losses and trading above the $38,800 level.
Bitcoin is now testing the 50% Fib retracement level of the recent decline from the $40,450 swing high to $38,000 low. On the upside, an initial resistance is near the $29,300. The next key resistance is near the $39,500 level. There is also a key bearish trend line forming with resistance near $39,500 on the hourly chart of the BTC/USD pair.
The trend line is close to the 61.8% Fib retracement level of the recent decline from the $40,450 swing high to $38,000 low. The main resistance is now forming near the $40,000 level.
Source: BTCUSD on TradingView.com
A clear move above the $40,000 resistance zone might start a decent increase. The next major resistance is near $40,450 and the 100 hourly simple moving average, above which the price might rise towards the $41,200 level.
If bitcoin fails to start a recovery wave above the $39,500 resistance zone, it could continue to move down. An immediate support on the downside is near the $38,500 zone.
The next major support is seen near the $38,000 level. If there is a downside break below the $38,000 support zone, the price might gain bearish momentum for a move to $36,800.
Technical indicators:
Hourly MACD – The MACD is now losing pace in the bullish zone.
Hourly RSI (Relative Strength Index) – The RSI for BTC/USD is just above the 50 level.
Major Support Levels – $38,500, followed by $38,000.
Major Resistance Levels – $39,500, $40,000 and $40,450.
Tags: bitcoinbtcusdBTCUSDTxbtusd
FeedzyRead More
More than $246 million in crypto futures positions were wiped out in a single day…
The largest cryptocurrency is up 4.2% on the week despite Friday's reversal, with attention now…
Lekker Capital CIO Quinn Thompson argues on X that collapsing mining economics, combined with a…
A Cambridge study spanning 11 years and 68 verified cable failures found that Bitcoin's physical…
On-chain analytics firm Glassnode has explained how a flip in Bitcoin short-term holder profitability could…
A crypto analyst is calling for a $40,000 Bitcoin price surge within 60 days, and…