Bitcoin started a major increase above the $40,000 resistance against the US Dollar. BTC might correct lower, but downsides could be limited below $40,000.
Bitcoin was able to clear the $40,000 resistance and entered a positive zone.
The price is trading above $40,500 and the 100 hourly simple moving average.
There is a key bullish trend line forming with support near $39,250 on the hourly chart of the BTC/USD pair (data feed from Kraken).
The pair might correct lower, but there is a key support forming near the $40,000 zone.
Bitcoin Price Rallies 5%
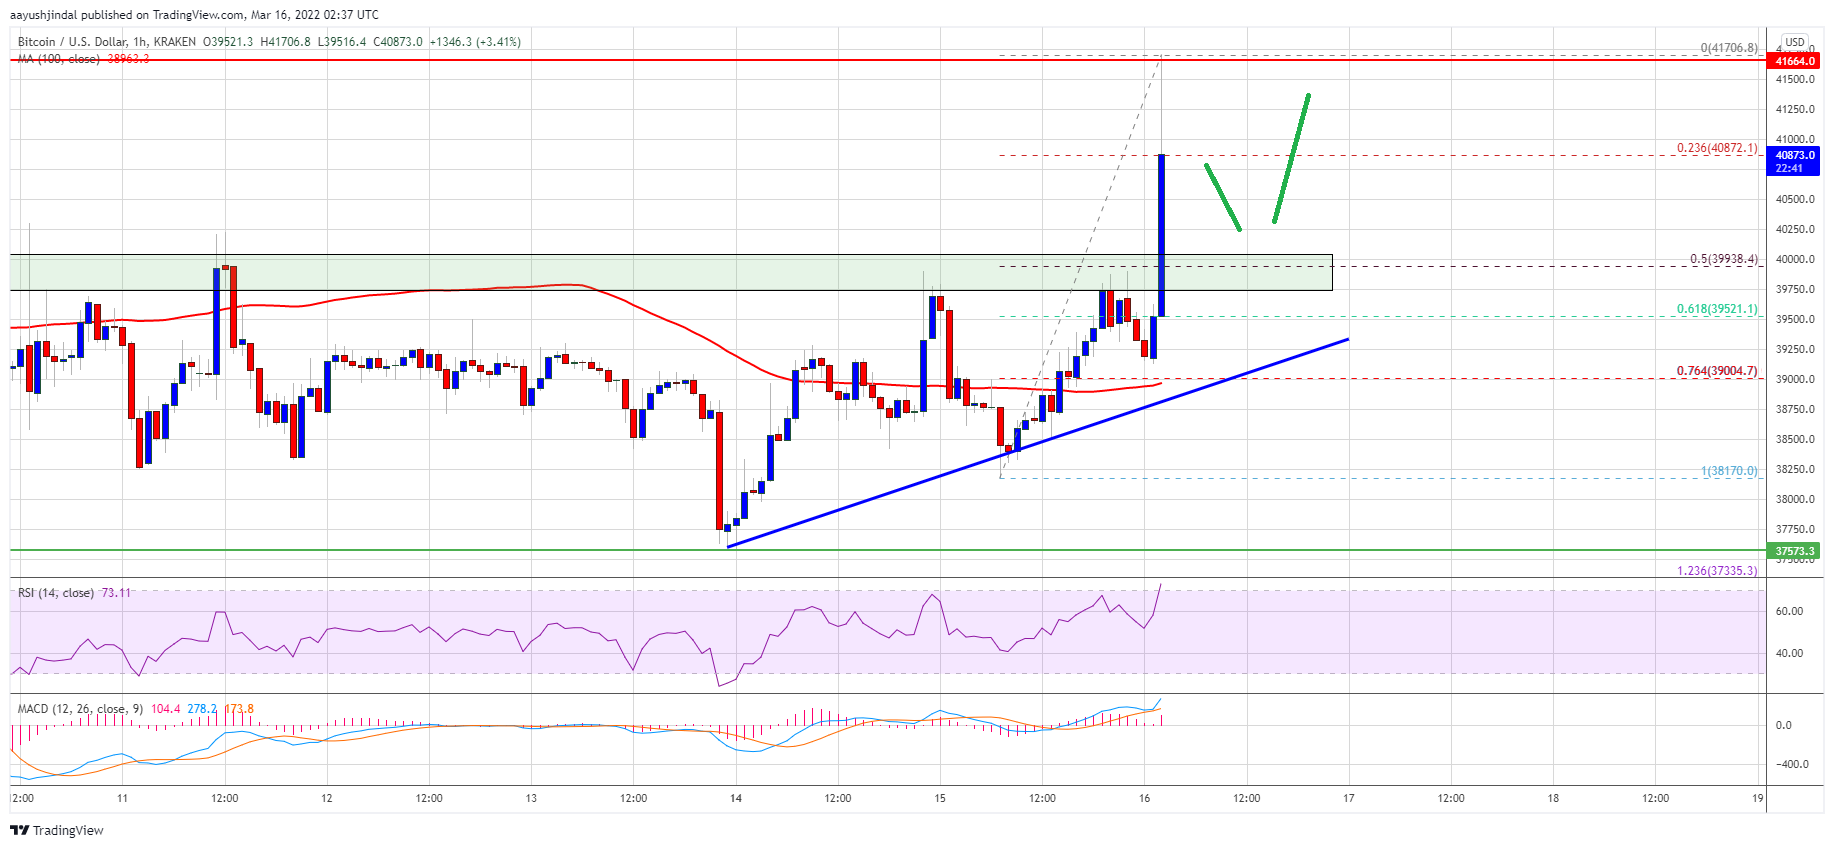
Bitcoin price formed a base above the $38,000 level. BTC started a steady increase above the $39,550 resistance level and the 100 hourly simple moving average.
It opened the doors for a move above the $40,000 resistance. The bulls took control and were able to push the price above the $41,000 resistance zone. The price gained over 5% and there was a move towards $41,800. A high is formed near $41,706 and the price is now correcting gains.
It traded below the $41,000 level. There was a test of the 23.6% Fib retracement level of the recent wave from the $38,170 swing low to $41,706 high.
On the downside, there are many support levels forming near $40,000. There is also a key bullish trend line forming with support near $39,250 on the hourly chart of the BTC/USD pair. On the upside, bitcoin might face resistance near the $41,200 level.
Source: BTCUSD on TradingView.com
The next major resistance could be near the recent high or $41,800. A clear move above the $41,800 level could even push the price above the $42,000 resistance. In the stated case, the price might rise towards the $43,200 level.
Dips Limited in BTC?
If bitcoin fails to clear the $41,200 resistance zone, it could start a downside correction. An immediate support on the downside is near the $40,500 zone.
The next major support is seen near the $40,000 level. It is near the 50% Fib retracement level of the recent wave from the $38,170 swing low to $41,706 high. The main support now sits near the trend line and $39,000.
Technical indicators:
Hourly MACD – The MACD is now losing pace in the bullish zone.
Hourly RSI (Relative Strength Index) – The RSI for BTC/USD is well above the 50 level.
Major Support Levels – $40,500, followed by $40,000.
Major Resistance Levels – $41,200, $41,800 and $42,000.
Bitcoin started a major increase above the $40,000 resistance against the US Dollar. BTC might correct lower, but downsides could be limited below $40,000.
Bitcoin was able to clear the $40,000 resistance and entered a positive zone.
The price is trading above $40,500 and the 100 hourly simple moving average.
There is a key bullish trend line forming with support near $39,250 on the hourly chart of the BTC/USD pair (data feed from Kraken).
The pair might correct lower, but there is a key support forming near the $40,000 zone.
Bitcoin price formed a base above the $38,000 level. BTC started a steady increase above the $39,550 resistance level and the 100 hourly simple moving average.
It opened the doors for a move above the $40,000 resistance. The bulls took control and were able to push the price above the $41,000 resistance zone. The price gained over 5% and there was a move towards $41,800. A high is formed near $41,706 and the price is now correcting gains.
It traded below the $41,000 level. There was a test of the 23.6% Fib retracement level of the recent wave from the $38,170 swing low to $41,706 high.
On the downside, there are many support levels forming near $40,000. There is also a key bullish trend line forming with support near $39,250 on the hourly chart of the BTC/USD pair. On the upside, bitcoin might face resistance near the $41,200 level.
Source: BTCUSD on TradingView.com
The next major resistance could be near the recent high or $41,800. A clear move above the $41,800 level could even push the price above the $42,000 resistance. In the stated case, the price might rise towards the $43,200 level.
If bitcoin fails to clear the $41,200 resistance zone, it could start a downside correction. An immediate support on the downside is near the $40,500 zone.
The next major support is seen near the $40,000 level. It is near the 50% Fib retracement level of the recent wave from the $38,170 swing low to $41,706 high. The main support now sits near the trend line and $39,000.
Technical indicators:
Hourly MACD – The MACD is now losing pace in the bullish zone.
Hourly RSI (Relative Strength Index) – The RSI for BTC/USD is well above the 50 level.
Major Support Levels – $40,500, followed by $40,000.
Major Resistance Levels – $41,200, $41,800 and $42,000.
Tags: bitcoinbtcusdBTCUSDTxbtusd
FeedzyRead More
U.S. spot bitcoin ETFs lost $2.97 billion across 10 trading days through Friday, the longest…
Bitcoin price started a fresh decline below the $73,800 zone. BTC is consolidating and might…
The creator of the Mayer Multiple argues bitcoin’s growing economic substance is compressing volatility and…
Prominent crypto analysis page XWIN Research Japan reports that Bitcoin has reached a new milestone:…
Bitcoin’s market cap has dropped to roughly $1.46 trillion, pushing it below several major technology…
Bitcoin’s return to $100,000 is still a popular target across the market for 2026, but…