Bitcoin started a major increase above the $40,000 resistance against the US Dollar. BTC might correct lower, but downsides could be limited below $40,000.
Bitcoin was able to clear the $40,000 resistance and entered a positive zone.
The price is trading above $40,500 and the 100 hourly simple moving average.
There is a key bullish trend line forming with support near $39,250 on the hourly chart of the BTC/USD pair (data feed from Kraken).
The pair might correct lower, but there is a key support forming near the $40,000 zone.
Bitcoin Price Rallies 5%
Bitcoin price formed a base above the $38,000 level. BTC started a steady increase above the $39,550 resistance level and the 100 hourly simple moving average.
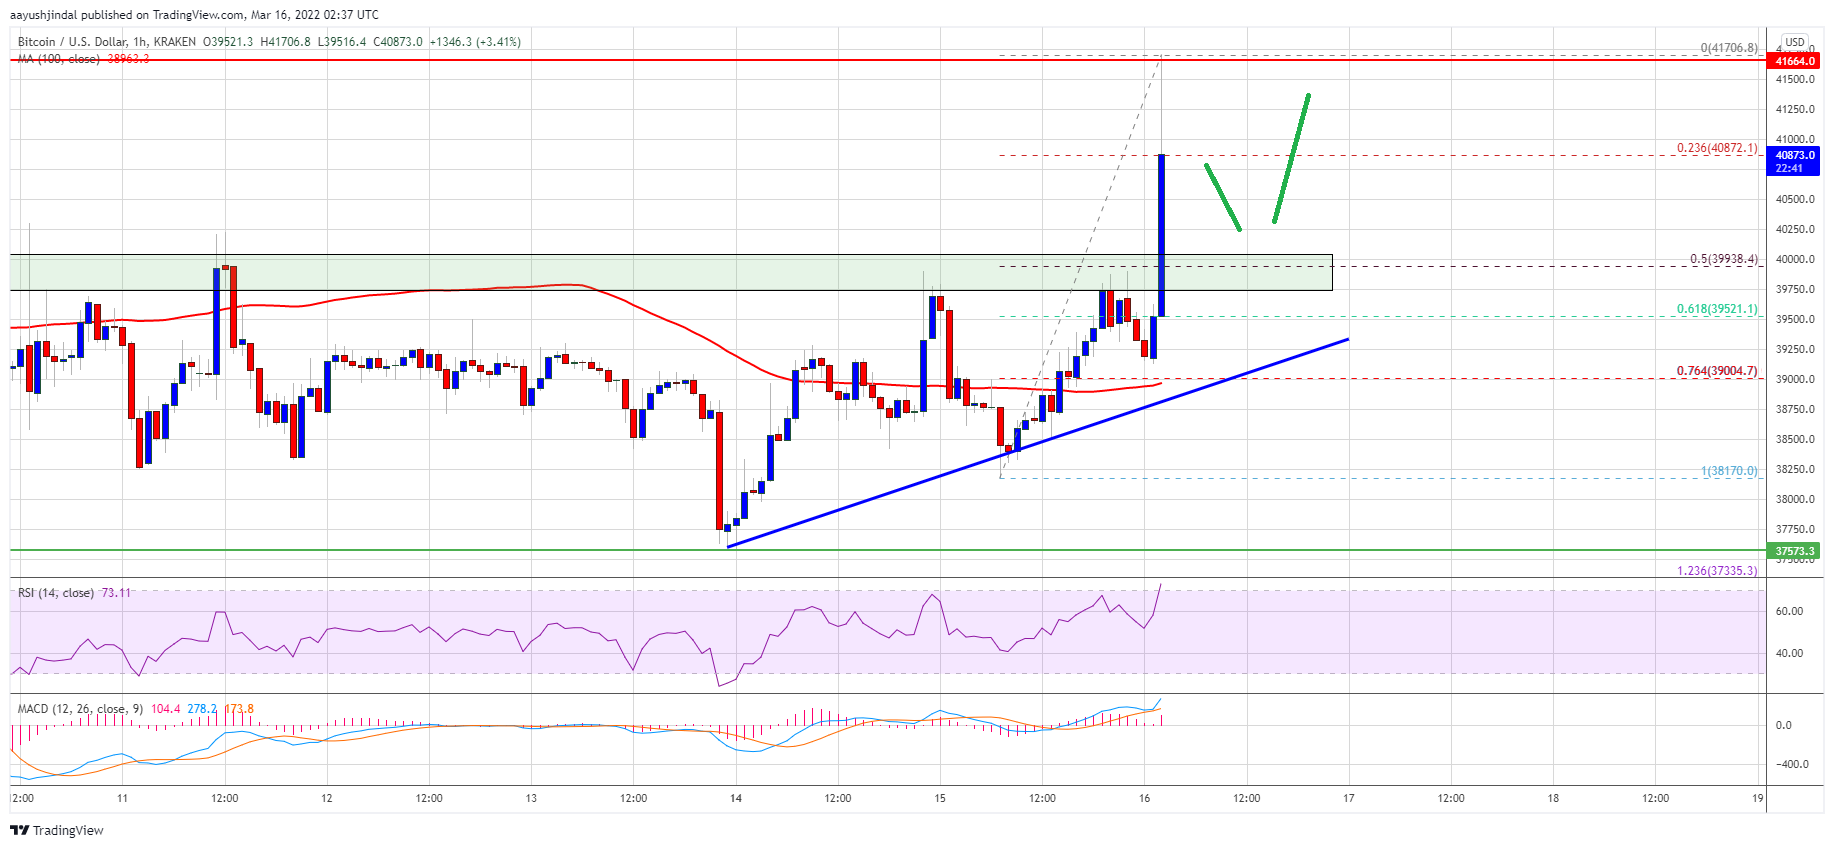
It opened the doors for a move above the $40,000 resistance. The bulls took control and were able to push the price above the $41,000 resistance zone. The price gained over 5% and there was a move towards $41,800. A high is formed near $41,706 and the price is now correcting gains.
It traded below the $41,000 level. There was a test of the 23.6% Fib retracement level of the recent wave from the $38,170 swing low to $41,706 high.
On the downside, there are many support levels forming near $40,000. There is also a key bullish trend line forming with support near $39,250 on the hourly chart of the BTC/USD pair. On the upside, bitcoin might face resistance near the $41,200 level.
Source: BTCUSD on TradingView.com
The next major resistance could be near the recent high or $41,800. A clear move above the $41,800 level could even push the price above the $42,000 resistance. In the stated case, the price might rise towards the $43,200 level.
Dips Limited in BTC?
If bitcoin fails to clear the $41,200 resistance zone, it could start a downside correction. An immediate support on the downside is near the $40,500 zone.
The next major support is seen near the $40,000 level. It is near the 50% Fib retracement level of the recent wave from the $38,170 swing low to $41,706 high. The main support now sits near the trend line and $39,000.
Technical indicators:
Hourly MACD – The MACD is now losing pace in the bullish zone.
Hourly RSI (Relative Strength Index) – The RSI for BTC/USD is well above the 50 level.
Major Support Levels – $40,500, followed by $40,000.
Major Resistance Levels – $41,200, $41,800 and $42,000.
Bitcoin started a major increase above the $40,000 resistance against the US Dollar. BTC might correct lower, but downsides could be limited below $40,000.
Bitcoin was able to clear the $40,000 resistance and entered a positive zone.
The price is trading above $40,500 and the 100 hourly simple moving average.
There is a key bullish trend line forming with support near $39,250 on the hourly chart of the BTC/USD pair (data feed from Kraken).
The pair might correct lower, but there is a key support forming near the $40,000 zone.
Bitcoin price formed a base above the $38,000 level. BTC started a steady increase above the $39,550 resistance level and the 100 hourly simple moving average.
It opened the doors for a move above the $40,000 resistance. The bulls took control and were able to push the price above the $41,000 resistance zone. The price gained over 5% and there was a move towards $41,800. A high is formed near $41,706 and the price is now correcting gains.
It traded below the $41,000 level. There was a test of the 23.6% Fib retracement level of the recent wave from the $38,170 swing low to $41,706 high.
On the downside, there are many support levels forming near $40,000. There is also a key bullish trend line forming with support near $39,250 on the hourly chart of the BTC/USD pair. On the upside, bitcoin might face resistance near the $41,200 level.
Source: BTCUSD on TradingView.com
The next major resistance could be near the recent high or $41,800. A clear move above the $41,800 level could even push the price above the $42,000 resistance. In the stated case, the price might rise towards the $43,200 level.
If bitcoin fails to clear the $41,200 resistance zone, it could start a downside correction. An immediate support on the downside is near the $40,500 zone.
The next major support is seen near the $40,000 level. It is near the 50% Fib retracement level of the recent wave from the $38,170 swing low to $41,706 high. The main support now sits near the trend line and $39,000.
Technical indicators:
Hourly MACD – The MACD is now losing pace in the bullish zone.
Hourly RSI (Relative Strength Index) – The RSI for BTC/USD is well above the 50 level.
Major Support Levels – $40,500, followed by $40,000.
Major Resistance Levels – $41,200, $41,800 and $42,000.
Tags: bitcoinbtcusdBTCUSDTxbtusd
FeedzyRead More
“The wildest thing about my $1 million prediction is that it's not wild at all,”…
Wall Street broker Bernstein took note of an institutional ownership shift as behind bitcoin's resilience…
Gains came for crypto and stocks as tensions around the Strait of Hormuz appeared to…
Every few years, a chart pattern resurfaces in the Bitcoin market that commands serious attention…
Bitcoin is showing early signs of recovery after firmly holding a major confluence support zone.…
Bitcoin Magazine Metaplanet Raises $255 Million, Eyes $531 Million Bitcoin Buying Spree Tokyo-listed investment firm…