Bitcoin is struggling to clear the $38,800 resistance against the US Dollar. BTC could decline heavily if it stays below the $39,000 pivot level.
Bitcoin is struggling to recover above $38,800 and $39,000 resistance levels.
The price is now trading below $38,600 and the 100 hourly simple moving average.
There is a major contracting triangle forming with resistance near $38,880 on the hourly chart of the BTC/USD pair (data feed from Kraken).
The pair must clear the $38,880 and $39,000 resistance levels to start a decent increase.
Bitcoin Price Eyes Next Break
Bitcoin price found support near the $37,400 level and started a recovery wave. BTC was able to reclaim the $38,000 level and slowly moved higher.
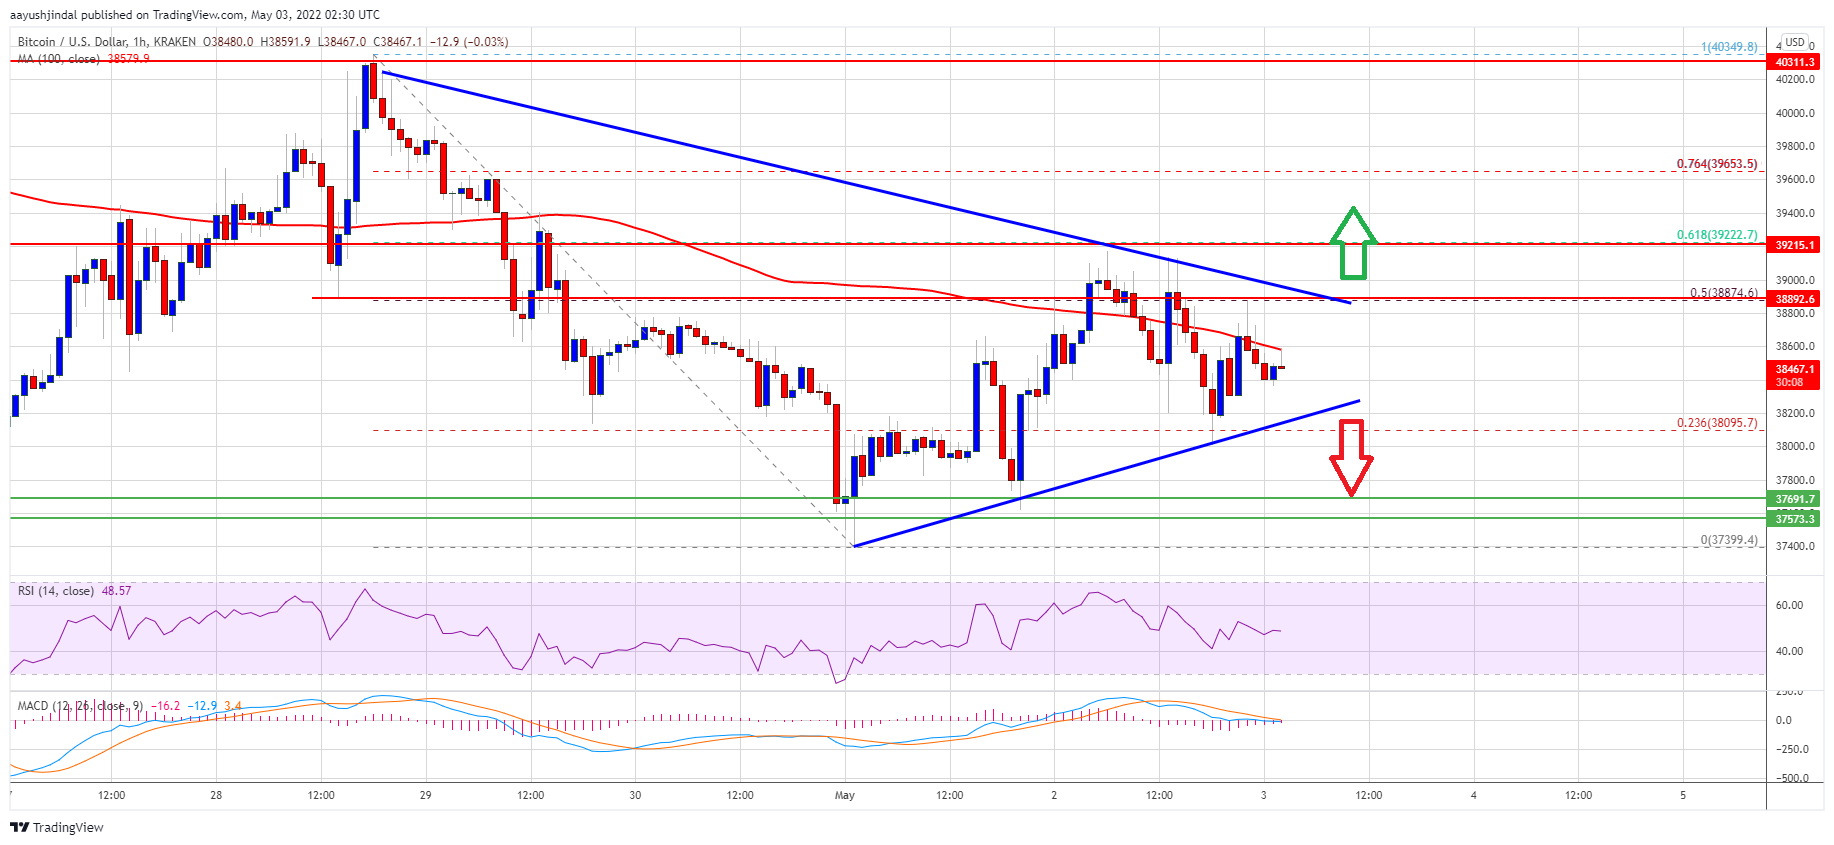
There was a clear move above the 23.6% Fib retracement level of the key drop from the $40,350 swing high to $37,400 low. The price attempted a clear move above the $38,800 resistance level and the 100 hourly simple moving average.
However, bitcoin price struggled to gain strength above the $39,000 level. It also failed to settle above the 50% Fib retracement level of the key drop from the $40,350 swing high to $37,400 low.
Besides, there is a major contracting triangle forming with resistance near $38,880 on the hourly chart of the BTC/USD pair. It is now facing resistance near the $38,600 level and the hourly simple moving average.
Source: BTCUSD on TradingView.com
The next key resistance could be near the $38,880 zone. A close above the $38,880 and $39,000 levels could open the doors for a decent increase. In the stated case, the price could even surpass the $39,250 resistance. The next major resistance is seen near the $40,000 level.
Another Decline in BTC?
If bitcoin fails to clear the $38,880 resistance zone, it could start a fresh decline. An immediate support on the downside is near the $38,400 level.
The next major support is seen near the $38,200 level and the triangle lower trend line. A downside break below the triangle support could even push the price below $38,000. The next major support is $37,400, below which the price could dive to $36,500.
Technical indicators:
Hourly MACD – The MACD is slowly losing pace in the bullish zone.
Hourly RSI (Relative Strength Index) – The RSI for BTC/USD is now just near the 50 level.
Major Support Levels – $38,400, followed by $38,200.
Major Resistance Levels – $38,880, $39,000 and $39,250.
Bitcoin is struggling to clear the $38,800 resistance against the US Dollar. BTC could decline heavily if it stays below the $39,000 pivot level.
Bitcoin is struggling to recover above $38,800 and $39,000 resistance levels.
The price is now trading below $38,600 and the 100 hourly simple moving average.
There is a major contracting triangle forming with resistance near $38,880 on the hourly chart of the BTC/USD pair (data feed from Kraken).
The pair must clear the $38,880 and $39,000 resistance levels to start a decent increase.
Bitcoin price found support near the $37,400 level and started a recovery wave. BTC was able to reclaim the $38,000 level and slowly moved higher.
There was a clear move above the 23.6% Fib retracement level of the key drop from the $40,350 swing high to $37,400 low. The price attempted a clear move above the $38,800 resistance level and the 100 hourly simple moving average.
However, bitcoin price struggled to gain strength above the $39,000 level. It also failed to settle above the 50% Fib retracement level of the key drop from the $40,350 swing high to $37,400 low.
Besides, there is a major contracting triangle forming with resistance near $38,880 on the hourly chart of the BTC/USD pair. It is now facing resistance near the $38,600 level and the hourly simple moving average.
Source: BTCUSD on TradingView.com
The next key resistance could be near the $38,880 zone. A close above the $38,880 and $39,000 levels could open the doors for a decent increase. In the stated case, the price could even surpass the $39,250 resistance. The next major resistance is seen near the $40,000 level.
If bitcoin fails to clear the $38,880 resistance zone, it could start a fresh decline. An immediate support on the downside is near the $38,400 level.
The next major support is seen near the $38,200 level and the triangle lower trend line. A downside break below the triangle support could even push the price below $38,000. The next major support is $37,400, below which the price could dive to $36,500.
Technical indicators:
Hourly MACD – The MACD is slowly losing pace in the bullish zone.
Hourly RSI (Relative Strength Index) – The RSI for BTC/USD is now just near the 50 level.
Major Support Levels – $38,400, followed by $38,200.
Major Resistance Levels – $38,880, $39,000 and $39,250.
Tags: bitcoinbtcusdBTCUSDTxbtusd
FeedzyRead More
Bitcoin’s recovery attempts are still being judged against a larger structure that has controlled price…
Bitcoin Magazine CME Group Goes Live With 24/7 Crypto Futures and Options, Launches Bitcoin Volatility…
Bitcoin is still trading above $60,000, but there are questions as to whether that area…
Michael Saylor's Strategy has evolved into a far more complex bitcoin-finance machine since it last…
With Strategy breaking its accumulation streak and many peers stepping aside, the list of active…
Bitcoin is approaching a pivotal moment, with several key support and resistance levels set to…