Bitcoin is still consolidating near the $20,000 zone against the US Dollar. BTC must clear the $20,550 resistance zone to start a steady increase.
Bitcoin is still struggling to gain pace above the $20,550 resistance.
The price is now trading near the $20,000 level and the 100 hourly simple moving average.
There is a key bearish trend line forming with resistance near $20,330 on the hourly chart of the BTC/USD pair (data feed from Kraken).
The pair must clear the $20,350 zone and $20,550 to start a fresh increase.
Bitcoin Price Faces Hurdles
Bitcoin price remained well supported above the $19,550 zone. BTC formed a base and started a fresh upward move above the $20,000 resistance zone.
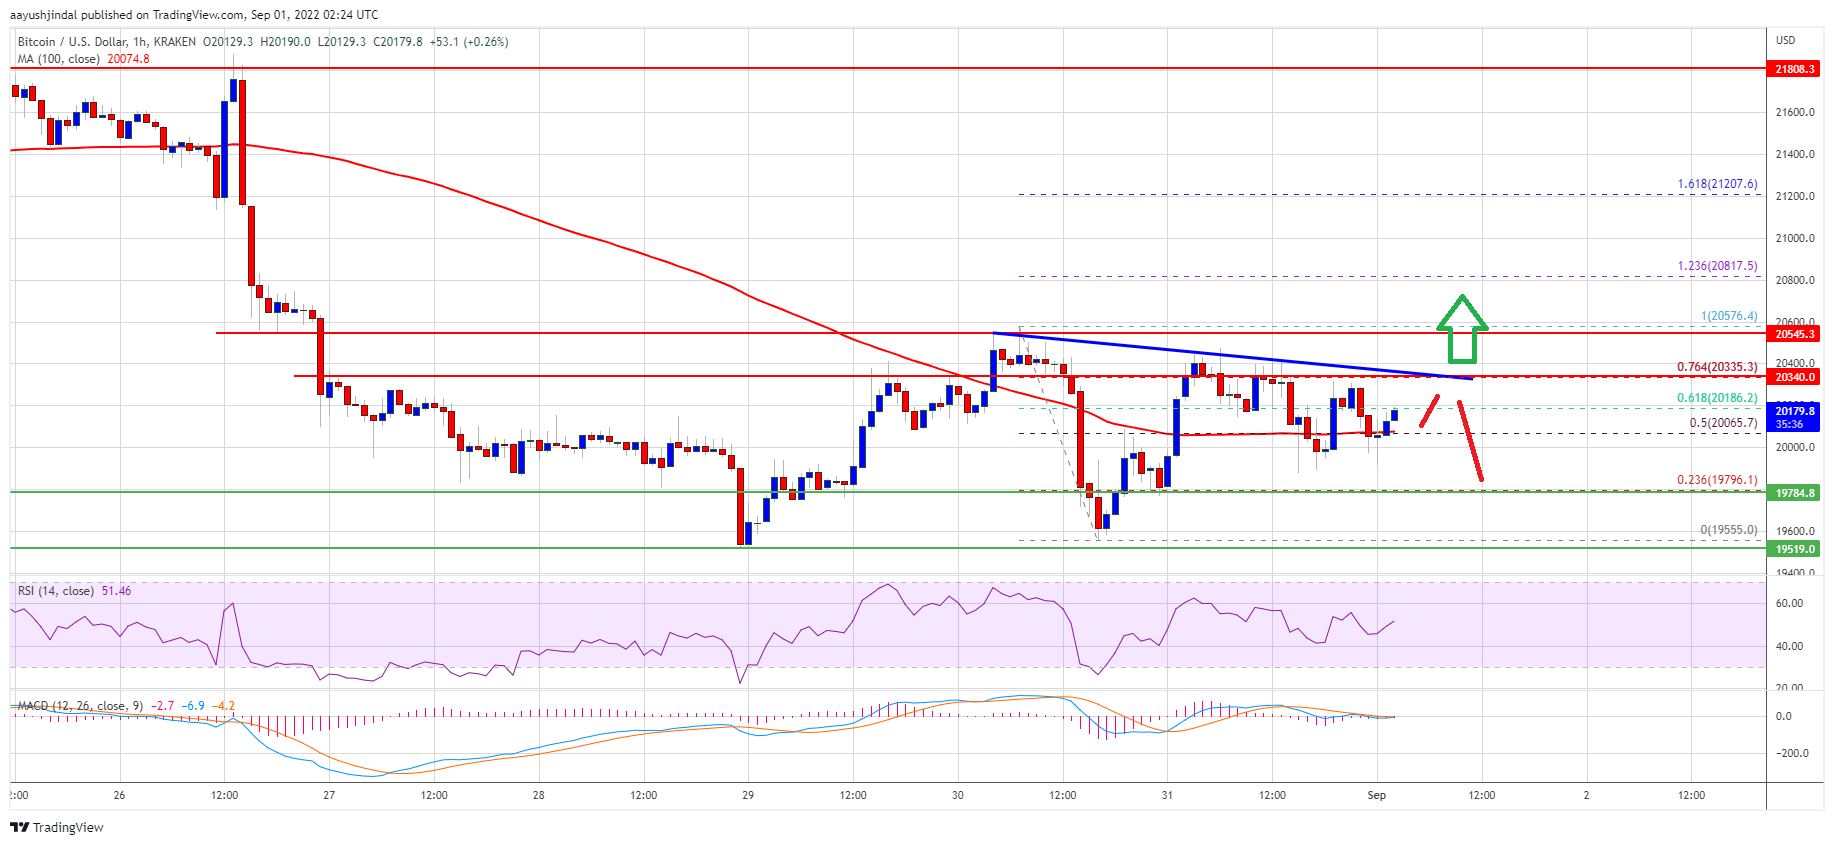
There was a push above the $20,200 level and the 100 hourly simple moving average. The price even cleared the 61.8% Fib retracement level of the downward move from the $20,576 swing high to $19,555 low. However, the price stayed below the $20,550 resistance zone.
Bitcoin price is now trading near the $20,000 level and the 100 hourly simple moving average. On the upside, an immediate resistance is near the $20,350 level.
There is also a key bearish trend line forming with resistance near $20,330 on the hourly chart of the BTC/USD pair. The trend line is near the 76.4% Fib retracement level of the downward move from the $20,576 swing high to $19,555 low.
Source: BTCUSD on TradingView.com
The next major resistance sits near the $20,550 and $20,575 levels. A clear move above the $20,575 resistance might send the price towards $21,000. Any more gains might start a steady move towards the $22,000 resistance zone.
Fresh Decline in BTC?
If bitcoin fails to clear the $20,550 resistance zone, it could start another decline. An immediate support on the downside is near the $20,000 zone.
The next major support sits near the $19,800 level. The main support sits near the $19,550 level. A break below the $19,550 support might spark a sharp move to $19,000. Any more losses might call for a move to $18,500 in the near term.
Technical indicators:
Hourly MACD – The MACD is now losing pace in the bullish zone.
Hourly RSI (Relative Strength Index) – The RSI for BTC/USD is now below the 50 level.
Major Support Levels – $19,880, followed by $19,500.
Major Resistance Levels – $20,350, $20,550 and $21,000.
Bitcoin is still consolidating near the $20,000 zone against the US Dollar. BTC must clear the $20,550 resistance zone to start a steady increase.
Bitcoin is still struggling to gain pace above the $20,550 resistance.
The price is now trading near the $20,000 level and the 100 hourly simple moving average.
There is a key bearish trend line forming with resistance near $20,330 on the hourly chart of the BTC/USD pair (data feed from Kraken).
The pair must clear the $20,350 zone and $20,550 to start a fresh increase.
Bitcoin price remained well supported above the $19,550 zone. BTC formed a base and started a fresh upward move above the $20,000 resistance zone.
There was a push above the $20,200 level and the 100 hourly simple moving average. The price even cleared the 61.8% Fib retracement level of the downward move from the $20,576 swing high to $19,555 low. However, the price stayed below the $20,550 resistance zone.
Bitcoin price is now trading near the $20,000 level and the 100 hourly simple moving average. On the upside, an immediate resistance is near the $20,350 level.
There is also a key bearish trend line forming with resistance near $20,330 on the hourly chart of the BTC/USD pair. The trend line is near the 76.4% Fib retracement level of the downward move from the $20,576 swing high to $19,555 low.
Source: BTCUSD on TradingView.com
The next major resistance sits near the $20,550 and $20,575 levels. A clear move above the $20,575 resistance might send the price towards $21,000. Any more gains might start a steady move towards the $22,000 resistance zone.
If bitcoin fails to clear the $20,550 resistance zone, it could start another decline. An immediate support on the downside is near the $20,000 zone.
The next major support sits near the $19,800 level. The main support sits near the $19,550 level. A break below the $19,550 support might spark a sharp move to $19,000. Any more losses might call for a move to $18,500 in the near term.
Technical indicators:
Hourly MACD – The MACD is now losing pace in the bullish zone.
Hourly RSI (Relative Strength Index) – The RSI for BTC/USD is now below the 50 level.
Major Support Levels – $19,880, followed by $19,500.
Major Resistance Levels – $20,350, $20,550 and $21,000.
Tags: bitcoinbtcusdBTCUSDTxbtusd
NewsBTCRead More
At its last stage for government approval, the state's executive council rejected the bond project…
Bitcoin Magazine JPMorgan Says the Real Threat to Bitcoin Isn’t Strategy (MSTR) — It’s Private…
Redemption requests in the $2 trillion private credit market surged to $15.6 billion in the…
Bitcoin Magazine Bitcoin’s New Debt Machine is Facing Its First Major Test Public companies kept…
Compass Point analysts Michael Donovan and Ed Engel said markets are giving little credit to…
Bitcoin Magazine New Hampshire Council Rejects $100 Million Bitcoin-Backed Bond The New Hampshire Executive Council…