Bitcoin fund support near $29,350 and recovered higher against the US Dollar. BTC must clear the $31,000 resistance and the 100 hourly SMA to continue higher.
Bitcoin started a recovery wave from the $29,350 zone.
The price is now trading below the $31,000 level and the 100 hourly simple moving average.
There is a major bearish trend line forming with resistance near $31,000 on the hourly chart of the BTC/USD pair (data feed from Kraken).
The pair could resume its decline if there is no clear move above the $31,000 resistance.
Bitcoin Price Reclaims $30K
Bitcoin price extended its decline below the $30,000 support zone. However, downsides were limited below the $29,500 level. The price formed a base near $29,350 and started a recovery wave.
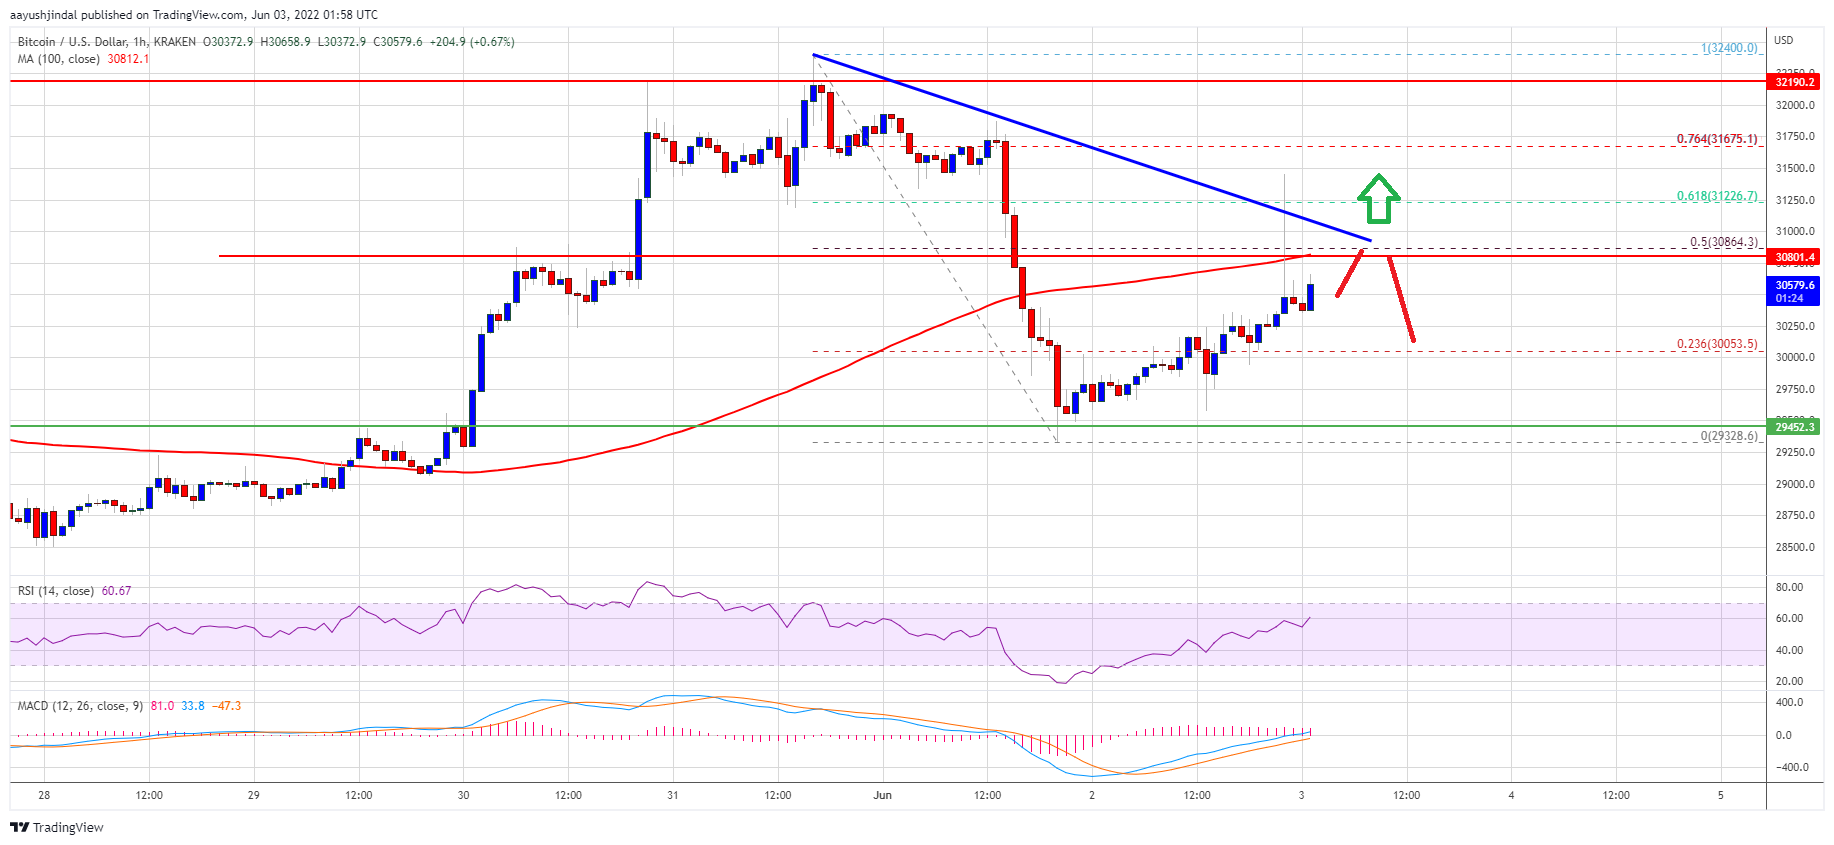
There was a move above the $30,000 resistance zone. The price climbed above the 23.6% Fib retracement level of the recent decline from the $32,400 swing high to $29,328 low. It even spiked above the $30,500 resistance zone, but the bears were active near the $31,000 level.
Bitcoin price is now trading below the $31,000 level and the 100 hourly simple moving average. There is also a major bearish trend line forming with resistance near $31,000 on the hourly chart of the BTC/USD pair.
The trend line is close to the 50% Fib retracement level of the recent decline from the $32,400 swing high to $29,328 low. An immediate resistance on the upside is near the $30,800 level. The next major resistance is near the $31,000 and the 100 hourly simple moving average.
Source: BTCUSD on TradingView.com
A clear move above the $31,000 resistance level could start another increase. In the stated case, the price could rise towards the $32,000 resistance. The next major resistance sits near the $32,400 level.
Fresh Decline in BTC?
If bitcoin fails to clear the $31,000 resistance zone, it could start another decline. An immediate support on the downside is near the $30,000 level.
The next major support is near the $29,350 level. A downside break below the $29,350 support may perhaps spark a sharp decline. In the stated case, the price could revisit the $28,250 support zone.
Technical indicators:
Hourly MACD – The MACD is now losing pace in the bullish zone.
Hourly RSI (Relative Strength Index) – The RSI for BTC/USD is now well above the 50 level.
Major Support Levels – $30,000, followed by $29,350.
Major Resistance Levels – $30,800, $31,000 and $32,000.
Bitcoin fund support near $29,350 and recovered higher against the US Dollar. BTC must clear the $31,000 resistance and the 100 hourly SMA to continue higher.
Bitcoin started a recovery wave from the $29,350 zone.
The price is now trading below the $31,000 level and the 100 hourly simple moving average.
There is a major bearish trend line forming with resistance near $31,000 on the hourly chart of the BTC/USD pair (data feed from Kraken).
The pair could resume its decline if there is no clear move above the $31,000 resistance.
Bitcoin price extended its decline below the $30,000 support zone. However, downsides were limited below the $29,500 level. The price formed a base near $29,350 and started a recovery wave.
There was a move above the $30,000 resistance zone. The price climbed above the 23.6% Fib retracement level of the recent decline from the $32,400 swing high to $29,328 low. It even spiked above the $30,500 resistance zone, but the bears were active near the $31,000 level.
Bitcoin price is now trading below the $31,000 level and the 100 hourly simple moving average. There is also a major bearish trend line forming with resistance near $31,000 on the hourly chart of the BTC/USD pair.
The trend line is close to the 50% Fib retracement level of the recent decline from the $32,400 swing high to $29,328 low. An immediate resistance on the upside is near the $30,800 level. The next major resistance is near the $31,000 and the 100 hourly simple moving average.
Source: BTCUSD on TradingView.com
A clear move above the $31,000 resistance level could start another increase. In the stated case, the price could rise towards the $32,000 resistance. The next major resistance sits near the $32,400 level.
If bitcoin fails to clear the $31,000 resistance zone, it could start another decline. An immediate support on the downside is near the $30,000 level.
The next major support is near the $29,350 level. A downside break below the $29,350 support may perhaps spark a sharp decline. In the stated case, the price could revisit the $28,250 support zone.
Technical indicators:
Hourly MACD – The MACD is now losing pace in the bullish zone.
Hourly RSI (Relative Strength Index) – The RSI for BTC/USD is now well above the 50 level.
Major Support Levels – $30,000, followed by $29,350.
Major Resistance Levels – $30,800, $31,000 and $32,000.
Tags: bitcoinbtcusdBTCUSDTxbtusd
FeedzyRead More
Bitcoin Magazine Strategy (MSTR) Stock Craters 10%, Hits Two-Year Low as Bitcoin Crashes Below $60K,…
Bitcoin Magazine Bitcoin Price Collapses to $59,000 — and the Worst May Not Be Over…
South Korean memory chip giant on Wednesday filed to raise nearly $30 billion in a…
TL;DR BlackRock says a 1% to 2% Bitcoin allocation can be reasonable in a multi-asset…
A 50% drop from recent highs has pushed the asset into a zone historically labeled…
Bitcoin Magazine Bitcoin Price Crashes Toward $61,000 as Bloodbath Engulfs Crypto Stocks Bitcoin price is…