Bitcoin fund support near $29,350 and recovered higher against the US Dollar. BTC must clear the $31,000 resistance and the 100 hourly SMA to continue higher.
Bitcoin started a recovery wave from the $29,350 zone.
The price is now trading below the $31,000 level and the 100 hourly simple moving average.
There is a major bearish trend line forming with resistance near $31,000 on the hourly chart of the BTC/USD pair (data feed from Kraken).
The pair could resume its decline if there is no clear move above the $31,000 resistance.
Bitcoin Price Reclaims $30K
Bitcoin price extended its decline below the $30,000 support zone. However, downsides were limited below the $29,500 level. The price formed a base near $29,350 and started a recovery wave.
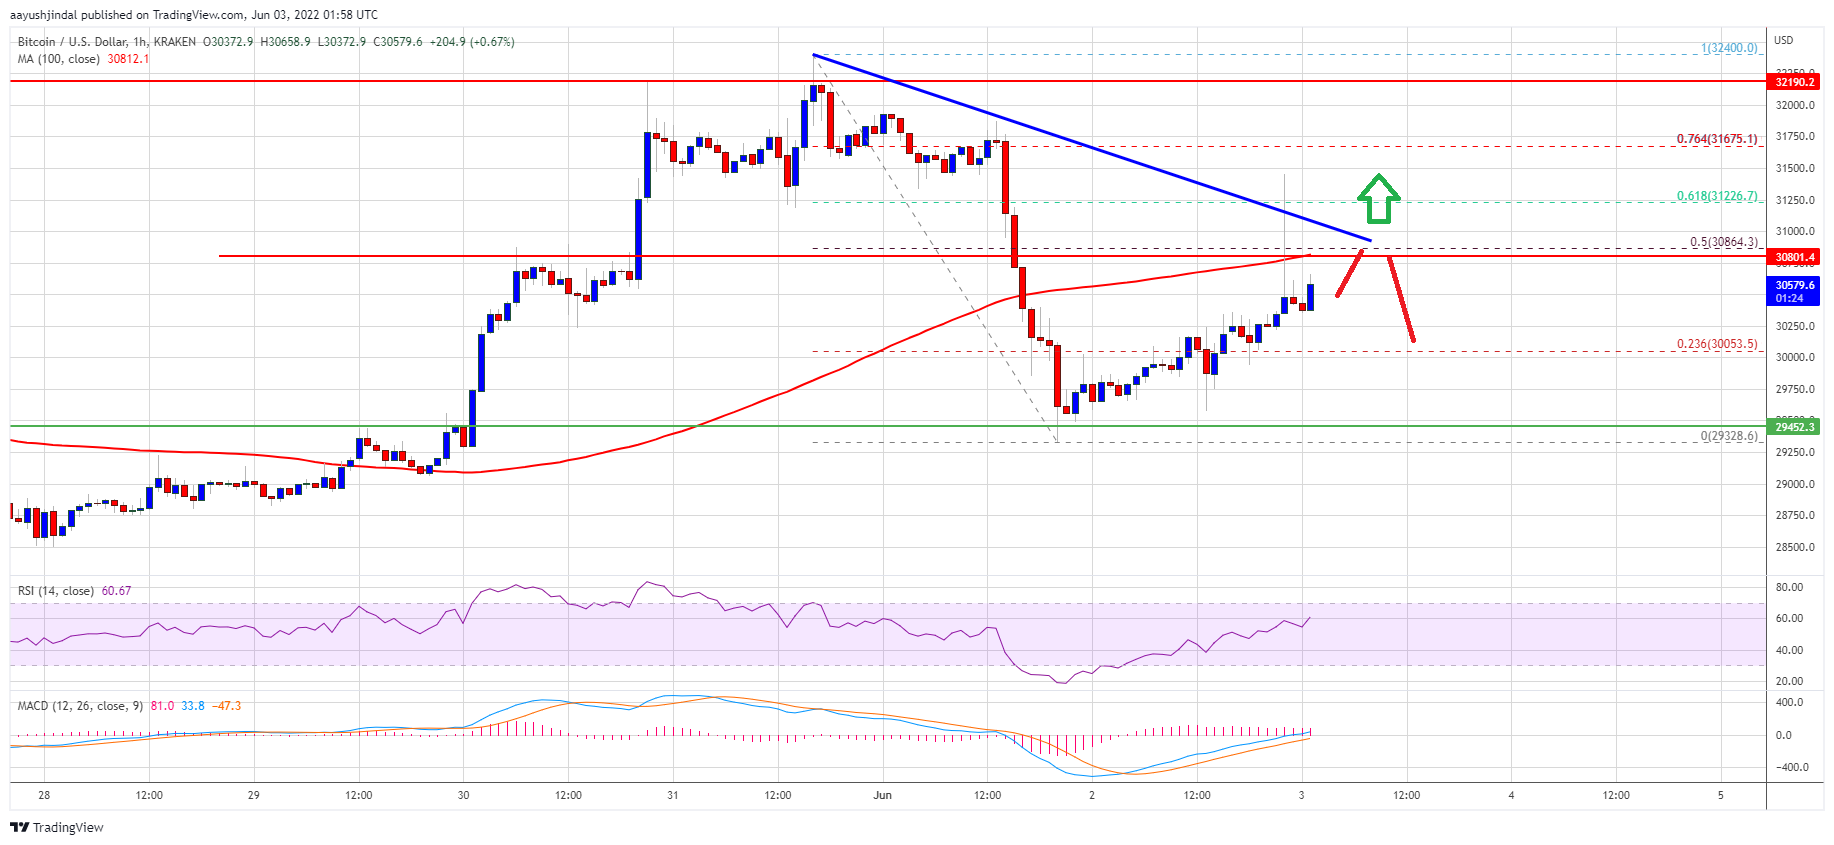
There was a move above the $30,000 resistance zone. The price climbed above the 23.6% Fib retracement level of the recent decline from the $32,400 swing high to $29,328 low. It even spiked above the $30,500 resistance zone, but the bears were active near the $31,000 level.
Bitcoin price is now trading below the $31,000 level and the 100 hourly simple moving average. There is also a major bearish trend line forming with resistance near $31,000 on the hourly chart of the BTC/USD pair.
The trend line is close to the 50% Fib retracement level of the recent decline from the $32,400 swing high to $29,328 low. An immediate resistance on the upside is near the $30,800 level. The next major resistance is near the $31,000 and the 100 hourly simple moving average.
Source: BTCUSD on TradingView.com
A clear move above the $31,000 resistance level could start another increase. In the stated case, the price could rise towards the $32,000 resistance. The next major resistance sits near the $32,400 level.
Fresh Decline in BTC?
If bitcoin fails to clear the $31,000 resistance zone, it could start another decline. An immediate support on the downside is near the $30,000 level.
The next major support is near the $29,350 level. A downside break below the $29,350 support may perhaps spark a sharp decline. In the stated case, the price could revisit the $28,250 support zone.
Technical indicators:
Hourly MACD – The MACD is now losing pace in the bullish zone.
Hourly RSI (Relative Strength Index) – The RSI for BTC/USD is now well above the 50 level.
Major Support Levels – $30,000, followed by $29,350.
Major Resistance Levels – $30,800, $31,000 and $32,000.
Bitcoin fund support near $29,350 and recovered higher against the US Dollar. BTC must clear the $31,000 resistance and the 100 hourly SMA to continue higher.
Bitcoin started a recovery wave from the $29,350 zone.
The price is now trading below the $31,000 level and the 100 hourly simple moving average.
There is a major bearish trend line forming with resistance near $31,000 on the hourly chart of the BTC/USD pair (data feed from Kraken).
The pair could resume its decline if there is no clear move above the $31,000 resistance.
Bitcoin price extended its decline below the $30,000 support zone. However, downsides were limited below the $29,500 level. The price formed a base near $29,350 and started a recovery wave.
There was a move above the $30,000 resistance zone. The price climbed above the 23.6% Fib retracement level of the recent decline from the $32,400 swing high to $29,328 low. It even spiked above the $30,500 resistance zone, but the bears were active near the $31,000 level.
Bitcoin price is now trading below the $31,000 level and the 100 hourly simple moving average. There is also a major bearish trend line forming with resistance near $31,000 on the hourly chart of the BTC/USD pair.
The trend line is close to the 50% Fib retracement level of the recent decline from the $32,400 swing high to $29,328 low. An immediate resistance on the upside is near the $30,800 level. The next major resistance is near the $31,000 and the 100 hourly simple moving average.
Source: BTCUSD on TradingView.com
A clear move above the $31,000 resistance level could start another increase. In the stated case, the price could rise towards the $32,000 resistance. The next major resistance sits near the $32,400 level.
If bitcoin fails to clear the $31,000 resistance zone, it could start another decline. An immediate support on the downside is near the $30,000 level.
The next major support is near the $29,350 level. A downside break below the $29,350 support may perhaps spark a sharp decline. In the stated case, the price could revisit the $28,250 support zone.
Technical indicators:
Hourly MACD – The MACD is now losing pace in the bullish zone.
Hourly RSI (Relative Strength Index) – The RSI for BTC/USD is now well above the 50 level.
Major Support Levels – $30,000, followed by $29,350.
Major Resistance Levels – $30,800, $31,000 and $32,000.
Tags: bitcoinbtcusdBTCUSDTxbtusd
FeedzyRead More
Bitcoin Magazine David Bailey Confirmed As A Bitcoin 2026 Speaker David Bailey has been officially…
Bitcoin Magazine Paraguay Adopts Stricter Crypto Oversight, Mandates Detailed Transaction on Bitcoin Reporting Paraguay’s National…
Bitcoin Magazine Policy Group Calls for Bitcoin Inclusion in Proposed Crypto Tax Exemption The Bitcoin…
Bitcoin Magazine Corporate Bitcoin Holdings Hit Record High as Institutions Accumulate 2.8x Mining Supply: Report…
Research shows that only 8% to 10% of global Bitcoin hashrate runs in oil-sensitive power…
Today’s quantum computers are far from breaking Bitcoin’s cryptography and any real threat would likely…