Ripple struggled to clear the $0.550 resistance against the US Dollar. XRP price is now moving lower and might drop further similar to bitcoin.
Ripple faced a strong selling interest near the $0.55 zone against the US dollar.
The price is now trading below $0.500 and the 100 simple moving average (4-hours).
There was a break below a key bullish trend line with support near $0.4940 on the 4-hours chart of the XRP/USD pair (data source from Kraken).
The pair could decline heavily if there is a clear move below the $0.4650 support.
Ripple’s XRP Price Starts Decline
This past week, ripple’s XRP started a steady increase from the $0.4500 support zone. There was a clear move above the $0.480 and $0.505 resistance levels.
The price climbed above the $0.520 resistance, outperforming bitcoin and ethereum’s ether. However, the bulls failed once again to clear the key $0.550 resistance zone. A high was formed near $0.5486 and the price started a fresh decline.
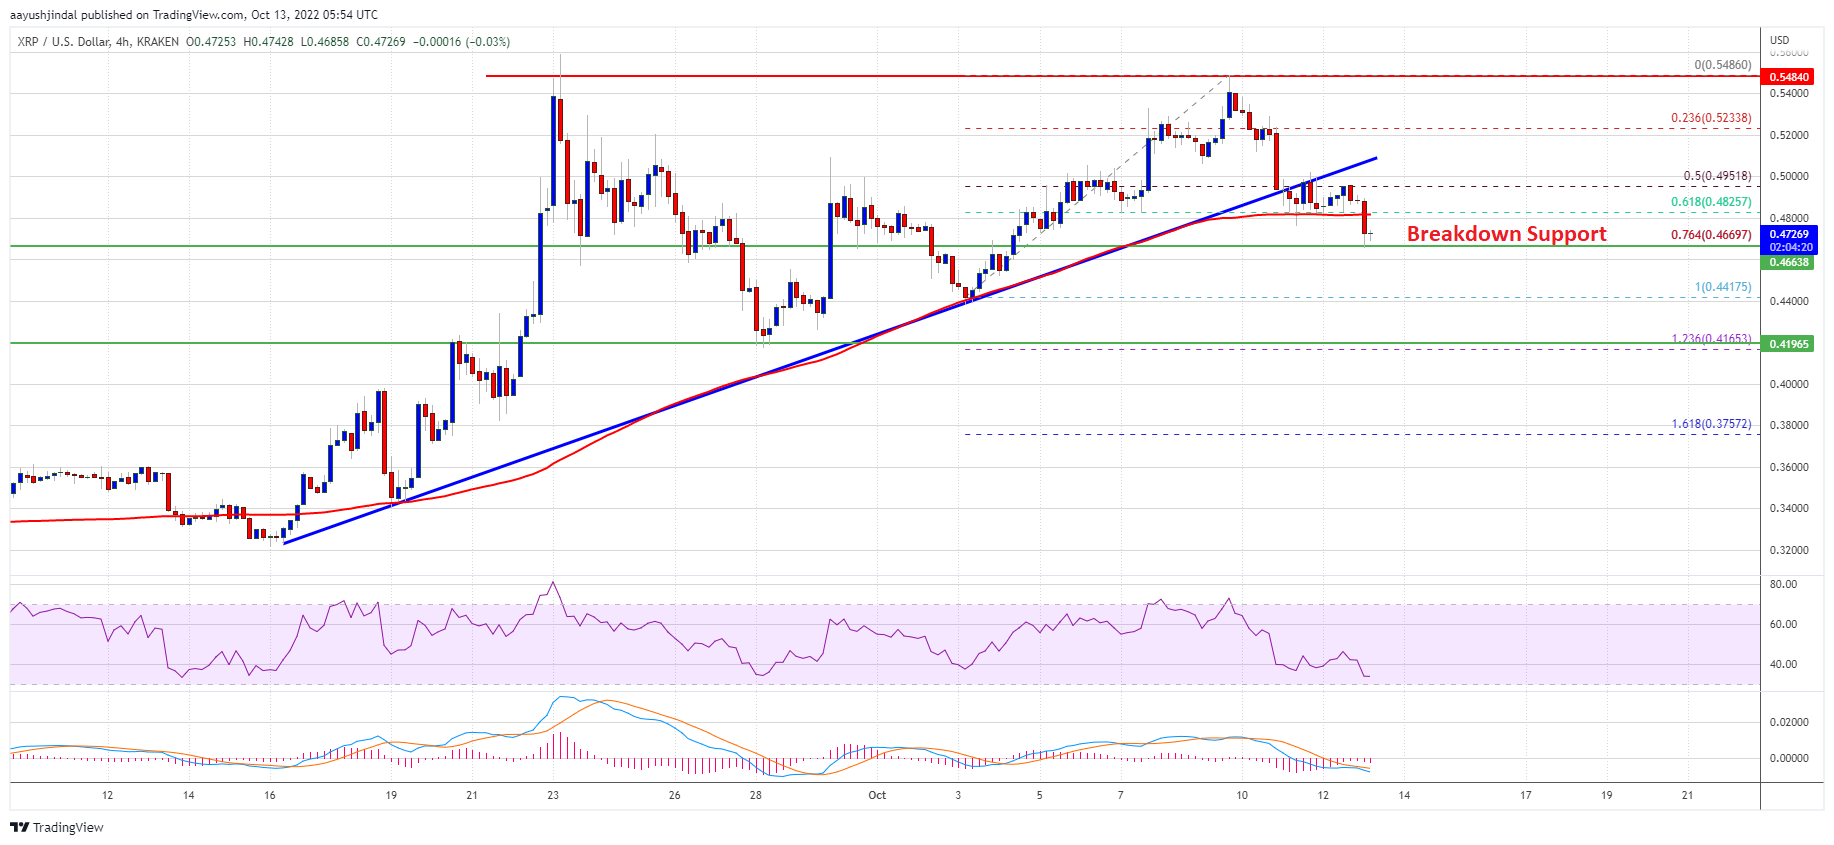
XRP price declined below the $0.52 and $0.50 support levels. There was a move below the 50% Fib retracement level of the upward move from the $0.4417 swing low to $0.5486 high.
Besides, there was a break below a key bullish trend line with support near $0.4940 on the 4-hours chart of the XRP/USD pair. The price is now trading below $0.500 and the 100 simple moving average (4-hours).’
Source: XRPUSD on TradingView.com
On the upside, the price is facing resistance near the $0.4825 level. The first major resistance is near the $0.500 zone. A successful break above the $0.50 and $0.505 resistance levels could spark another rally. The next key resistance is near the $0.520 level, above which the bulls are likely to aim a retest of the $0.55 barrier.
Downside Break in XRP?
If ripple fails to start a fresh increase above the $0.50 level, it could continue to move down. An initial support on the downside is near the $0.465 level. It is near the 61.8% Fib retracement level of the upward move from the $0.4417 swing low to $0.5486 high.
If there is a downside break and close below the $0.465 level, xrp price could start a major decline. In the stated case, the price is likely to drop towards the $0.42 support.
Technical Indicators
4-Hours MACD – The MACD for XRP/USD is now gaining pace in the bearish zone.
4-Hours RSI (Relative Strength Index) – The RSI for XRP/USD is now below the 50 level.
Major Support Levels – $0.465, $0.42 and $0.405.
Major Resistance Levels – $0.485, $0.505 and $0.550.
Ripple struggled to clear the $0.550 resistance against the US Dollar. XRP price is now moving lower and might drop further similar to bitcoin.
Ripple faced a strong selling interest near the $0.55 zone against the US dollar.
The price is now trading below $0.500 and the 100 simple moving average (4-hours).
There was a break below a key bullish trend line with support near $0.4940 on the 4-hours chart of the XRP/USD pair (data source from Kraken).
The pair could decline heavily if there is a clear move below the $0.4650 support.
This past week, ripple’s XRP started a steady increase from the $0.4500 support zone. There was a clear move above the $0.480 and $0.505 resistance levels.
The price climbed above the $0.520 resistance, outperforming bitcoin and ethereum’s ether. However, the bulls failed once again to clear the key $0.550 resistance zone. A high was formed near $0.5486 and the price started a fresh decline.
XRP price declined below the $0.52 and $0.50 support levels. There was a move below the 50% Fib retracement level of the upward move from the $0.4417 swing low to $0.5486 high.
Besides, there was a break below a key bullish trend line with support near $0.4940 on the 4-hours chart of the XRP/USD pair. The price is now trading below $0.500 and the 100 simple moving average (4-hours).’
Source: XRPUSD on TradingView.com
On the upside, the price is facing resistance near the $0.4825 level. The first major resistance is near the $0.500 zone. A successful break above the $0.50 and $0.505 resistance levels could spark another rally. The next key resistance is near the $0.520 level, above which the bulls are likely to aim a retest of the $0.55 barrier.
If ripple fails to start a fresh increase above the $0.50 level, it could continue to move down. An initial support on the downside is near the $0.465 level. It is near the 61.8% Fib retracement level of the upward move from the $0.4417 swing low to $0.5486 high.
If there is a downside break and close below the $0.465 level, xrp price could start a major decline. In the stated case, the price is likely to drop towards the $0.42 support.
Technical Indicators
4-Hours MACD – The MACD for XRP/USD is now gaining pace in the bearish zone.
4-Hours RSI (Relative Strength Index) – The RSI for XRP/USD is now below the 50 level.
Major Support Levels – $0.465, $0.42 and $0.405.
Major Resistance Levels – $0.485, $0.505 and $0.550.
Tags: RipplexrpXRPUSDxrpusdcxrpusdt
NewsBTCRead More
TL;DR TradingView analysts are watching whether Bitcoin can hold the $60,000–$63,700 support region. Bullish setups…
TL;DR A June 20 X post tracked 24 Bitcoin perps and futures contracts in a…
TL;DR Binance India said Bitcoin increasingly reflects broader macro market dynamics. A TradingView analyst linked…
TL;DR SHAY_ANALYTICS says BTCUSD confirmed a bearish breakdown from a multi-month symmetrical triangle. The analyst…
Bitcoin Magazine JPMorgan: Bitcoin Mining Costs Have ‘Worsened’ as BTC Trades Below Production Cost Bitcoin…
TL;DR Planned US-Iran technical talks in Switzerland were postponed on Friday, adding another layer of…