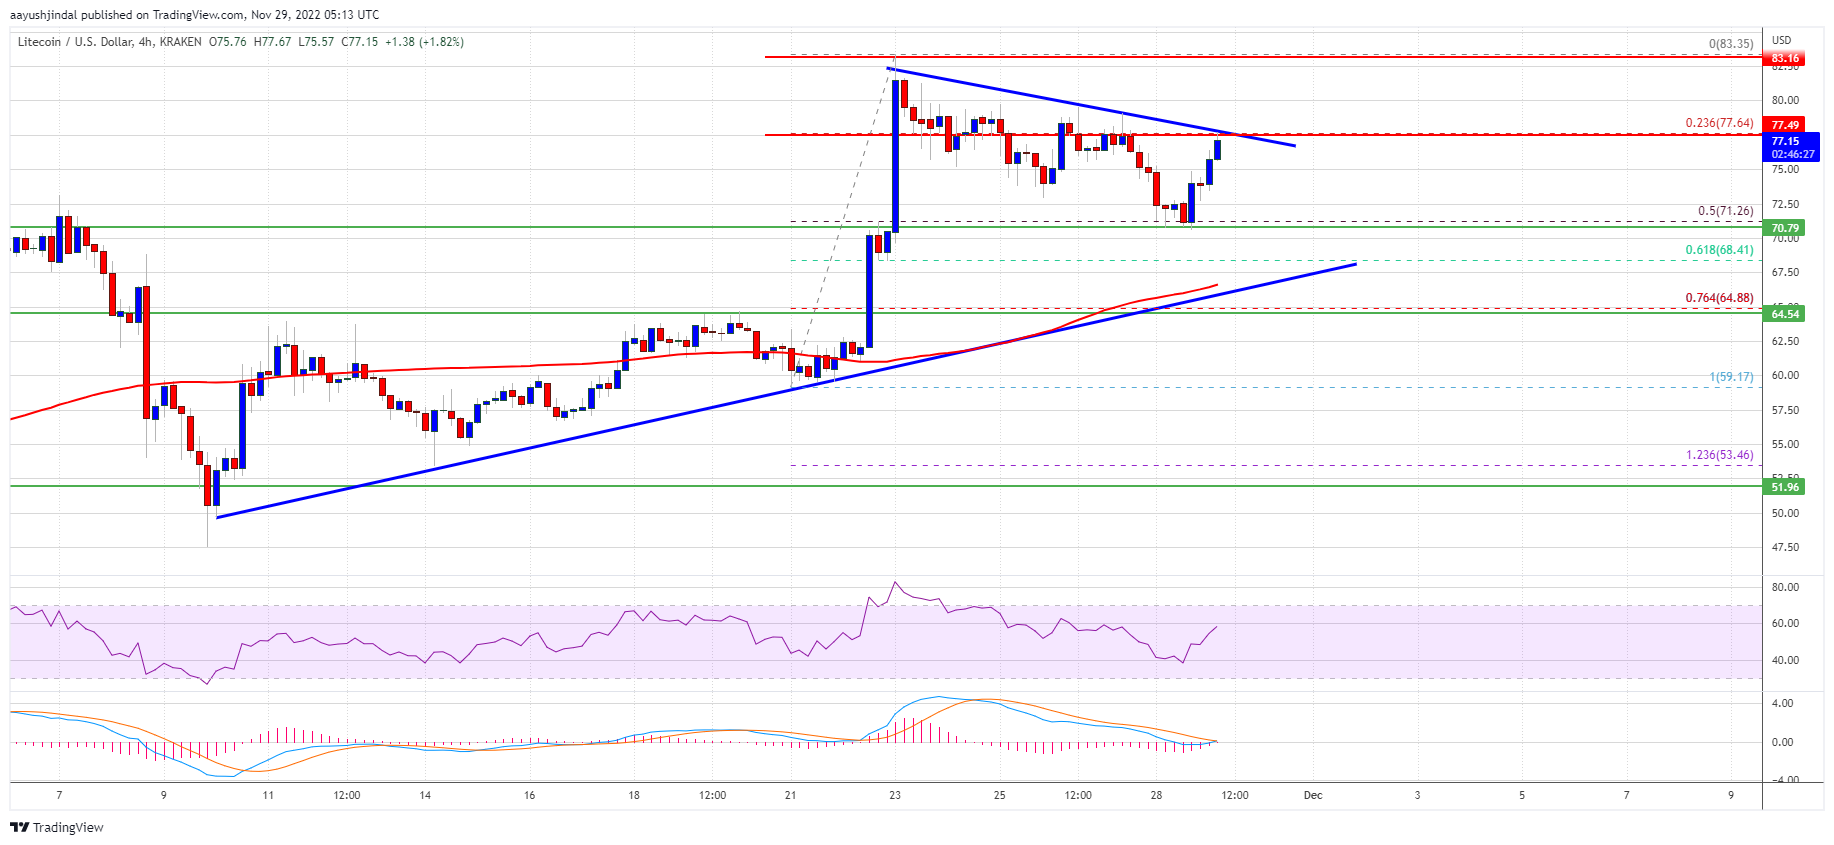
Litecoin price started a steady increase above the $65 resistance against the US Dollar. LTC is currently rising and might rally further towards the $100 level.
Litecoin started a strong increase above the $55 and $65 levels against the US Dollar.
The price is now trading above $65 and the 100 simple moving average (4-hours).
There is a key bearish trend line forming with resistance near $77.50 on the 4-hours chart of the LTC/USD pair (data feed from Kraken).
The price must clear the $77.50 and $84 to rise towards the $100 resistance zone.
In the past few days, litecoin price saw a decent increase above the $50 level against the US Dollar. LTC price rallied over 20% and outperformed both bitcoin and ethereum.
There was a move above the $65 and $75 resistance levels. The price even surpassed $80 and settled above the 100 simple moving average (4-hours). It traded as high as $83.35 before there was a downside correction. There was a move below the $80 and $75 support levels.
The price declined below the 23.6% Fib retracement level of the upward move from the $59.17 swing low to $83.35 high. However, litecoin price is now trading above $65 and the 100 simple moving average (4-hours).
It stayed above the 50% Fib retracement level of the upward move from the $59.17 swing low to $83.35 high. On the upside, an immediate resistance is near the $77.50 level.
Source: LTCUSD on TradingView.com
There is also a key bearish trend line forming with resistance near $77.50 on the 4-hours chart of the LTC/USD pair. If there is a clear break above the $77.50 resistance, the price could start a strong increase. In the stated case, the price is likely to continue higher towards the $85 and $90 levels. Any more gains might send ltc price towards the $100 resistance zone.
If Litecoin price fails to clear the $77.50 resistance level, there could be another pullback. An initial support on the downside is near the $71.20 level.
The first major support is forming near the $68 level. Any further losses may perhaps send the price towards the $55 support in the coming sessions.
Technical indicators:
4-hours MACD – The MACD is slowly moving into the bullish zone.
4-hours RSI (Relative Strength Index) – The RSI for LTC/USD is currently above the 50 level.
Major Support Levels – $71.20 followed by $68.00.
Major Resistance Levels – $77.50 and $85.00.
Tags: Litecoinlitecoin priceltc/usdltcusdcLTCUSDT
NewsBTCRead More
Long-term holding wallets have shifted to net accumulation from net distribution, according to Glassnode.Read MoreCoinDesk:…
Bitcoin climbed back above $60,000 for the first time in over a week after Fed…
Bitcoin Magazine Bitcoin Price Reclaims $60,000 As Strategy (MSTR) and Strive (ASST) Jump More Than…
Bitcoin Magazine AI’s Bitcoin Moment: Why the Open-Source Fight Looks Like Crypto Back in 2014…
Crypto exchange balances saw a notable withdrawal wave heading into July 1, with USDC and…
Bitcoin Magazine Moody’s Flags Quantum Threat to Bitcoin and Digital Assets After Trump Orders A…