Ethereum price recovered above the $2,920 resistance. ETH is trailing Bitcoin and might struggle to continue higher above the $3,050 resistance.
Ethereum started a recovery wave and even climbed above $3,000.
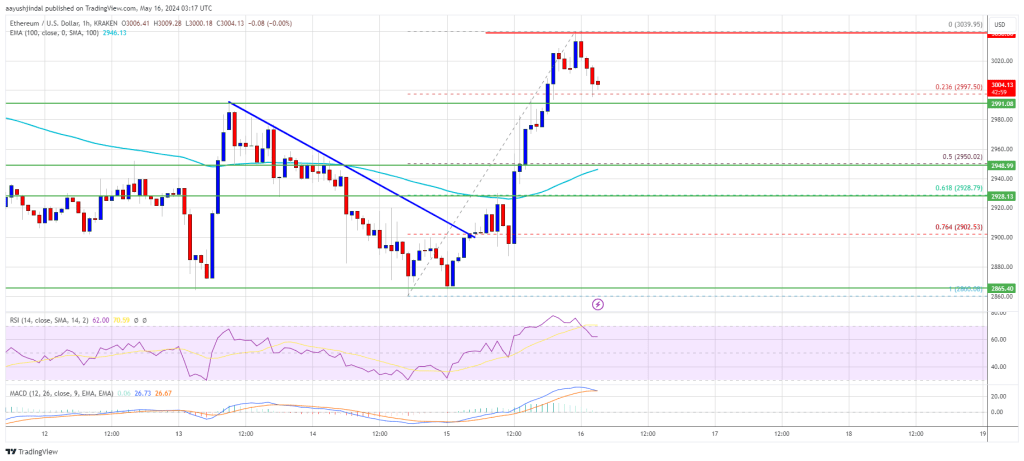
The price is trading above $2,950 and the 100-hourly Simple Moving Average.
There was a break above a key bearish trend line with resistance at $2,900 on the hourly chart of ETH/USD (data feed via Kraken).
The pair could now struggle to clear the $3,040 and $3,050 resistance levels.
Ethereum price remained stable above the $2,860 support zone and started a fresh increase. ETH gained nearly 5% but less than Bitcoin. There was a break above a key bearish trend line with resistance at $2,900 on the hourly chart of ETH/USD.
The bulls pumped the price above the $2,950 and $3,000 levels. A new weekly high was formed at $3,039 and the price is now consolidating gains. It tested the 23.6% Fib retracement level of the recent wave from the $2,860 swing low to the $3,039 high.
Ethereum is still well above $2,950 and the 100-hourly Simple Moving Average. Immediate resistance is near the $3,040 level. The first major resistance is near the $3,050 level.
An upside break above the $3,050 resistance might send the price higher. The next key resistance sits at $3,150, above which the price might gain traction and rise toward the $3,220 level. If there is a clear move above the $3,220 level, the price might rise and test the $3,350 resistance. Any more gains could send Ether toward the $3,500 resistance zone.
If Ethereum fails to clear the $3,050 resistance, it could start a downside correction. Initial support on the downside is near the $3,000 level. The first major support is near the $2,950 zone or the 50% Fib retracement level of the recent wave from the $2,860 swing low to the $3,039 high.
The next support is near the $2,930 level. A clear move below the $2,930 support might push the price toward $2,900. Any more losses might send the price toward the $2,860 level in the near term.
Technical Indicators
Hourly MACD – The MACD for ETH/USD is losing momentum in the bullish zone.
Hourly RSI – The RSI for ETH/USD is now above the 50 level.
Major Support Level – $2,950
Major Resistance Level – $3,050
[#item_full_content]NewsBTCRead MoreThe issuer behind the USDT stablecoin joined a $5.2 million funding round for Ark Labs,…
Bitcoin Magazine Ark Labs Raises $5.2M with Tether to Bring Programmable Finance to Bitcoin A…
Bloomberg Intelligence senior commodity strategist Mike McGlone said bitcoin could still fall back toward and…
BTC holds near $70,000 and outperforms major assets during Middle East tensions, even as derivatives…
Two Prime CEO Alexander Blume says the high yield product driving the buying surge carries…
Your day-ahead look for March 12, 2026Read MoreCoinDesk: Bitcoin, Ethereum, Crypto News and Price Data[#item_full_content]