Ethereum price climbed higher above the $2,450 resistance. ETH outpaced Bitcoin and seems to be setting up for a larger increase toward $2,880.
Ethereum is gaining pace above the $2,450 resistance level.
The price is trading above $2,500 and the 100-hourly Simple Moving Average.
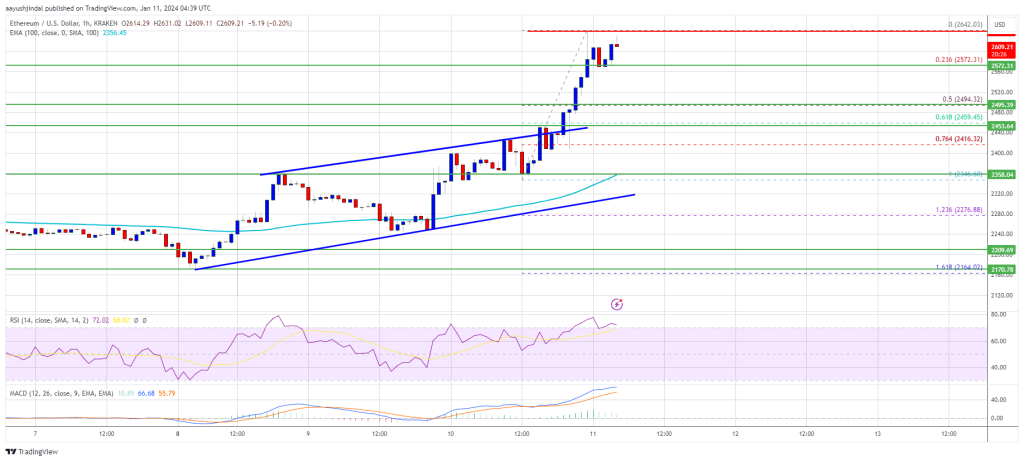
There was a break above a key rising channel with resistance near $2,440 on the hourly chart of ETH/USD (data feed via Kraken).
The pair is already up over 5% and might rise further above the $2,650 resistance.
Ethereum price started a decent increase above the $2,350 resistance. Recently, BTC’s spot ETFs were approved. However, there was no major increase in Bitcoin, but ETH gained bullish momentum.
There was a break above a key rising channel with resistance near $2,440 on the hourly chart of ETH/USD. The pair surged over 5% and even cleared the $2,500 resistance zone. There was a spike above the $2,600 resistance zone. A new multi-week high was formed near $2,642 and the price is now consolidating gains.
There was a minor decline below $2,600, but Ethereum stayed above the 23.6% Fib retracement level of the recent rally from the $2,346 swing low to the $2,642 high. Ethereum is now trading above $2,500 and the 100-hourly Simple Moving Average.
If there is a fresh increase, the price might face resistance near the $2,650 level. The next major resistance is now near $2,720. A clear move above the $2,720 level might send ETH toward $2,780. A close above the $2,780 resistance could push the price further into a bullish zone.
Source: ETHUSD on TradingView.com
The next key resistance is near $2,840. If the bulls push Ethereum above $2,840, there could be a rally toward $2,920. Any more gains might send the price toward the $3,000 zone.
If Ethereum fails to clear the $2,650 resistance, it could start a downside correction. Initial support on the downside is near the $2,580 level.
The first key support could be the $2,500 zone or the 50% Fib retracement level of the recent rally from the $2,346 swing low to the $2,642 high. A downside break and a close below $2,500 might send the price further lower. In the stated case, Ether could test the $2,440 support. Any more losses might send the price toward the $2,350 level.
Technical Indicators
Hourly MACD – The MACD for ETH/USD is gaining momentum in the bullish zone.
Hourly RSI – The RSI for ETH/USD is now above the 50 level.
Major Support Level – $2,500
Major Resistance Level – $2,650
[#item_full_content]NewsBTCRead MoreBitcoin is holding on to its weekend gains as oil trades lower. ETFs lost over…
Bitcoin and ether order books are deeper than before the crash, while altcoin liquidity keeps…
One year after a flash crash wiped out billions in leveraged crypto bets, traders have…
CoinDesk analysis finds 10 unusually large trading days in 2026, raising questions about how investors…
Bitcoin Magazine Bitcoin Life Insurer Meanwhile Raises $37.5M as Wealthy Families Look to Pass On…
Bitcoin Magazine Here’s How Not To Screw up Your Bitcoin Privacy Just one transaction can…