Ethereum price started a decent increase after Bitcoin gained momentum against the US dollar. ETH is rising and might test the key $1,750 resistance.
Ethereum started a decent increase above the $1,650 resistance.
The price is trading above $1,660 and the 100-hourly Simple Moving Average.
There is a key bullish trend line forming with support near $1,645 on the hourly chart of ETH/USD (data feed via Kraken).
The pair could climb further higher, but it might face strong resistance near $1,750.
Ethereum stayed above the $1,550 support zone. The recent pump in Bitcoin above the $28,500 resistance sparked bullish moves in ETH. There was a steady increase above the $1,600 and $1,620 resistance levels.
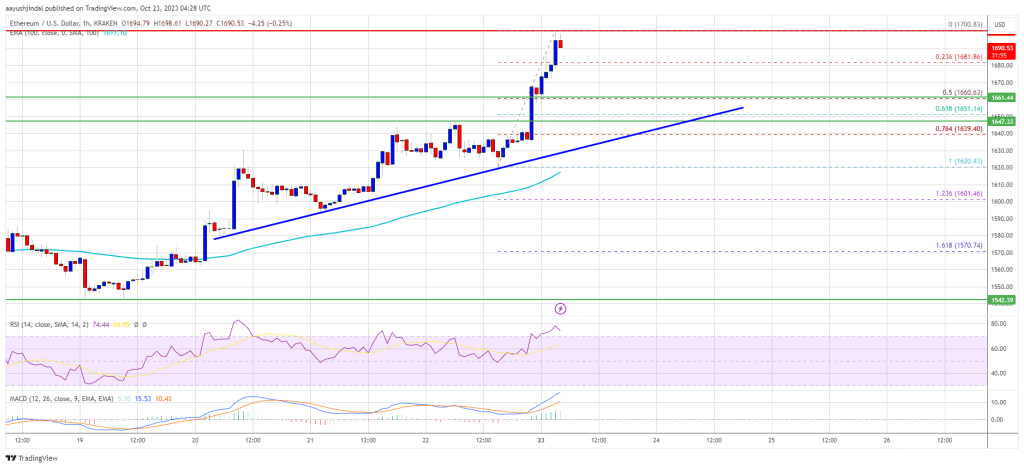
The price even cleared the key $1,650 resistance zone. A high is formed near $1,700 and the price is now consolidating gains. It is trading well above the 23.6% Fib retracement level of the upward move from the $1,620 swing low to the $1,700 high.
Ethereum is now trading above $1,660 and the 100-hourly Simple Moving Average. There is also a key bullish trend line forming with support near $1,645 on the hourly chart of ETH/USD. The trend line is near the 61.8% Fib retracement level of the upward move from the $1,620 swing low to the $1,700 high.
On the upside, the price is facing resistance near the $1,700 level. The first major resistance is near the $1,720 zone. The next key resistance is $1,750, where the bears might emerge. To continue higher, the price must settle above the $1,750 resistance.
Source: ETHUSD on TradingView.com
In the stated case, Ether could start a strong increase toward the $1,880 resistance. Any more gains might open the doors for a move toward $2,000.
If Ethereum fails to clear the $1,700 resistance, it could start a downside correction. Initial support on the downside is near the $1,660 level.
The next key support is $1,645 and the trend line zone. A downside break below the $1,645 support might send the price further lower. In the stated case, the price could drop toward the $1,620 level and the 100-hourly Simple Moving Average. Any more losses may perhaps send Ether toward the $1,550 level.
Technical Indicators
Hourly MACD – The MACD for ETH/USD is gaining momentum in the bullish zone.
Hourly RSI – The RSI for ETH/USD is now above the 50 level.
Major Support Level – $1,645
Major Resistance Level – $1,700
[#item_full_content]NewsBTCRead MoreData shows the Bitcoin perpetual futures market has seen a negative Funding Rate recently, suggesting…
Despite the crypto market’s renewed weakness on Thursday, a new AI-driven market model produced by…
The recent price action echoes the November–January pattern, showing weak conviction among the “buy the…
Morgan Stanley has filed to launch a spot Bitcoin ETF with the ticker MSBT and…
Oil prices slipped as major economies announced joint efforts to stabilize energy markets.Read MoreCoinDesk: Bitcoin,…
BTQ Technologies moved a key Bitcoin (BTC) security proposal from theory to practice on Thursday,…