Dogecoin is climbing higher above the $0.065 resistance against the US Dollar. DOGE could rally over 20% if it clears the $0.070 resistance zone.
DOGE started a decent increase above the $0.0625 resistance against the US dollar.
The price is trading below the $0.0650 level and the 100 simple moving average (4 hours).
There is a key bullish trend line forming with support near $0.0650 on the 4-hour chart of the DOGE/USD pair (data source from Kraken).
The price could start a strong rally like Bitcoin if it clears the $0.070 resistance.
After forming a base above the $0.0575 level, Dogecoin price started a fresh increase. DOGE broke the $0.060 resistance zone to move into a positive zone.
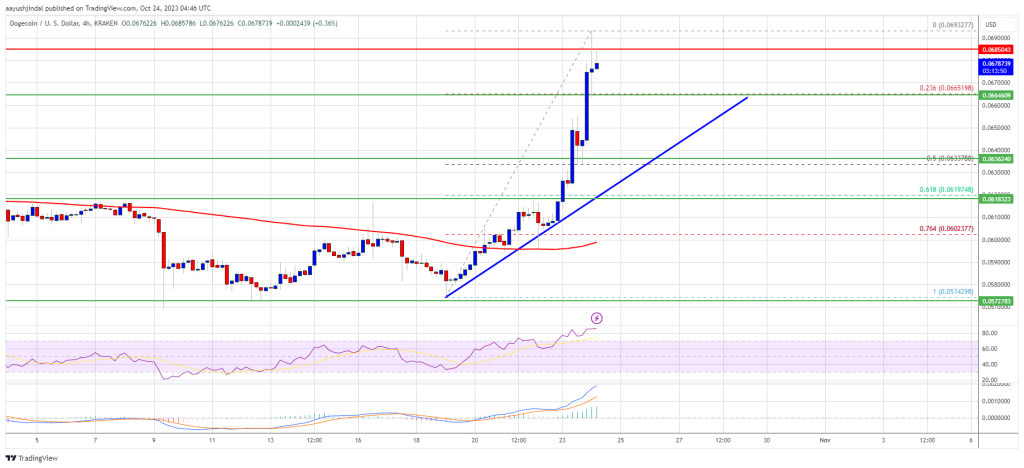
The recent pump in Bitcoin and Ethereum also pushed DOGE further higher. There was a steady increase above the $0.0650 resistance zone. A high is formed near $0.0693 and the price is now consolidating gains. It is also above the 23.6% Fib retracement level of the recent increase from the $0.0574 swing low to the $0.0693 high.
DOGE is now trading above the $0.065 level and the 100 simple moving average (4 hours). On the upside, the price is facing resistance near the $0.0685 level. There is also a key bullish trend line forming with support near $0.0650 on the 4-hour chart of the DOGE/USD pair.
Source: DOGEUSD on TradingView.com
The first major resistance is near the $0.0685 level. The main resistance is near $0.070. A close above the $0.070 resistance might send the price toward the $0.0735 resistance. The next major resistance is near $0.0750. Any more gains might send the price toward the $0.080 level.
If DOGE’s price fails to gain pace above the $0.070 level, it could start a downside correction. Initial support on the downside is near the $0.0665 level.
The next major support is near the $0.0650 level. If there is a downside break below the $0.0650 support, the price could decline further. In the stated case, the price might decline toward the $0.0632 level or the 50% Fib retracement level of the recent increase from the $0.0574 swing low to the $0.0693 high.
Technical Indicators
4 Hours MACD – The MACD for DOGE/USD is now gaining momentum in the bullish zone.
4 Hours RSI (Relative Strength Index) – The RSI for DOGE/USD is now above the 50 level.
Major Support Levels – $0.0665, $0.0650, and $0.0632.
Major Resistance Levels – $0.0685, $0.0700, and $0.0750.
[#item_full_content]NewsBTCRead MoreA potential US military strike on Iran’s main oil export terminal helped push Bitcoin to…
Bitcoin Magazine Bitcoin Price Surges Above $75,000 as Bullish Momentum Builds The bitcoin price climbed…
The alleged theft of 2,323 bitcoin has triggered a High Court dispute testing how English…
Bitcoin Magazine Bitcoin at Key Support Levels — Why Jack Mallers Says Turn On DCA…
Data shows the Bitcoin Fear & Greed Index has marked an improvement after the latest…
Bitcoin Magazine Eric Trump Confirmed As Speaker For Bitcoin 2026 Conference Bitcoin Magazine has confirmed…