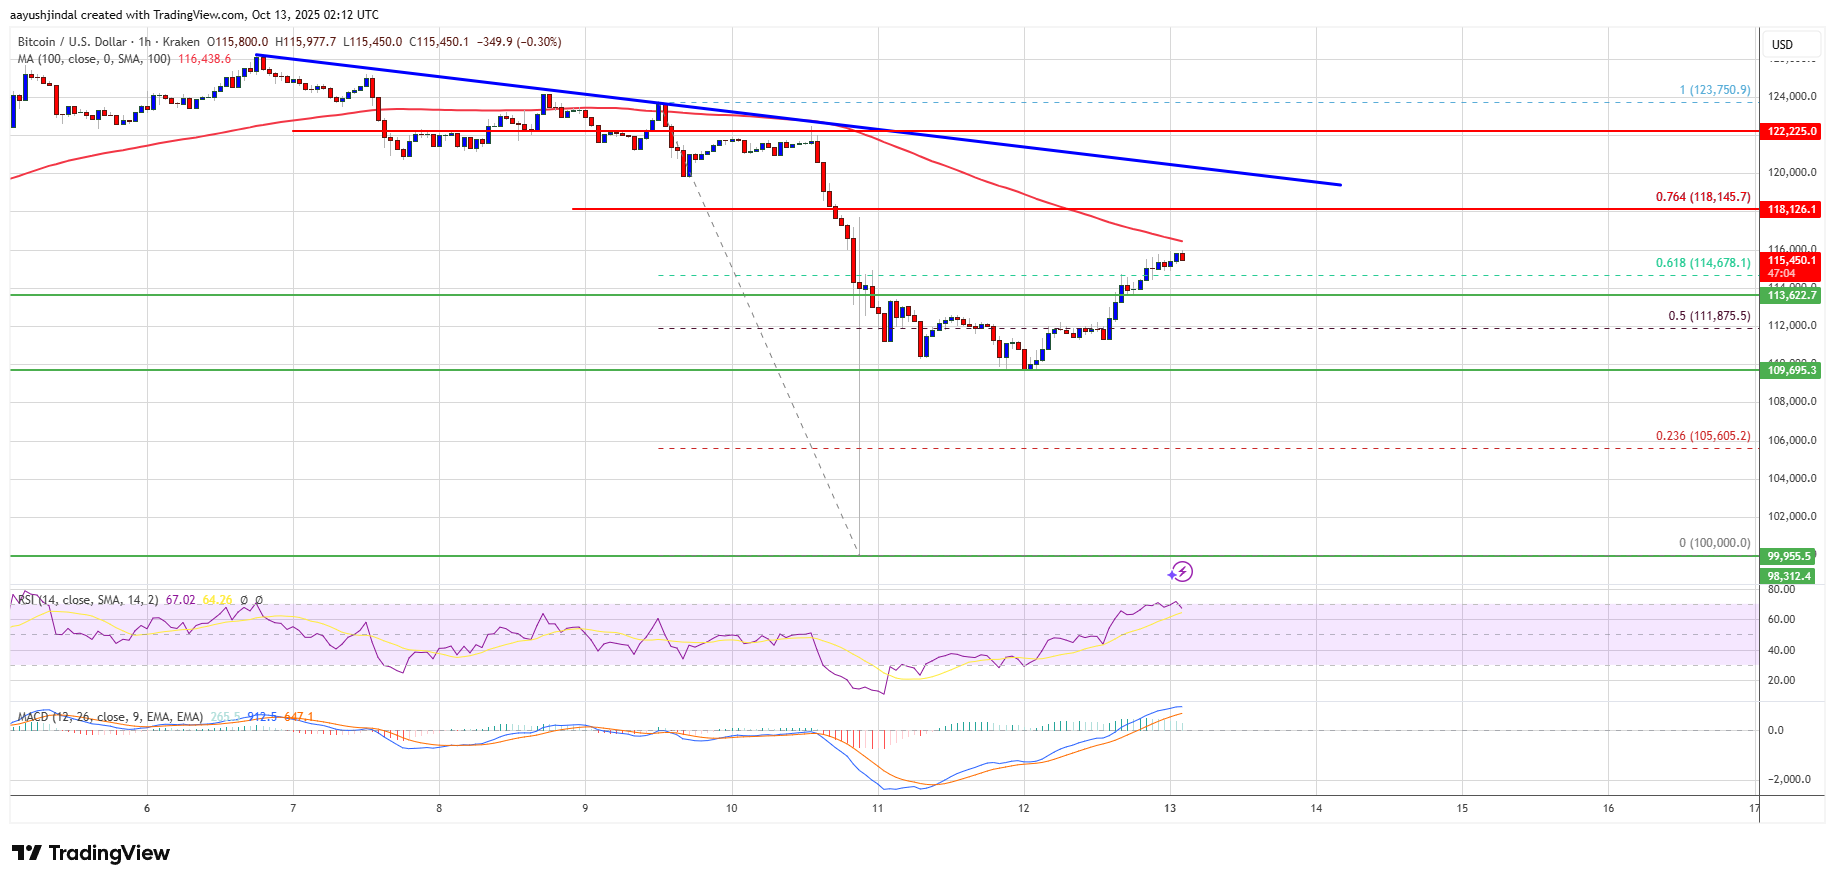
Bitcoin price corrected losses and traded above the $114,000 level. BTC is now struggling and might face hurdles near the $116,000 level.
Bitcoin started a recovery wave above the $113,500 resistance level.
The price is trading below $116,000 and the 100 hourly Simple moving average.
There is a bearish trend line forming with resistance at $119,500 on the hourly chart of the BTC/USD pair (data feed from Kraken).
The pair might continue to move down if it trades below the $113,500 zone.
Bitcoin price started a recovery wave after a massive liquidation event below $110,000. BTC recovered above the $111,500 and $112,000 resistance levels.
The price climbed above the 50% Fib retracement level of the sharp decline from the $123,750 swing high to the $100,000 low. The bulls even pushed the price above the $113,500 resistance level. However, there are many hurdles on the upside.
Bitcoin is now trading below $116,500 and the 100 hourly Simple moving average. Besides, there is a bearish trend line forming with resistance at $119,500 on the hourly chart of the BTC/USD pair.
Immediate resistance on the upside is near the $116,000 level. The first key resistance is near the $116,250 level. The next resistance could be $118,000 and the 76.4% Fib retracement level of the sharp decline from the $123,750 swing high to the $100,000 low.
A close above the $118,000 resistance might send the price further higher. In the stated case, the price could rise and test the $119,500 resistance and the trend line. Any more gains might send the price toward the $120,000 level. The next barrier for the bulls could be $122,500.
If Bitcoin fails to rise above the $116,000 resistance zone, it could start a fresh decline. Immediate support is near the $114,000 level. The first major support is near the $113,500 level.
The next support is now near the $113,500 zone. Any more losses might send the price toward the $112,500 support in the near term. The main support sits at $110,500, below which BTC might struggle to recover in the short term.
Technical indicators:
Hourly MACD – The MACD is now gaining pace in the bullish zone.
Hourly RSI (Relative Strength Index) – The RSI for BTC/USD is now above the 50 level.
Major Support Levels – $113,500, followed by $112,500.
Major Resistance Levels – $116,000 and $118,000.
[#item_full_content]NewsBTCRead MoreWarsh’s Jackson Hole speech could shape expectations for Fed support of Treasury buybacks, with implications…
The indictor has flipped positive for the first time since May as BTC looks to…
Every major but HYPE gained over 24 hours, capping a week that added 9% to…
Bitcoin Magazine Genius Group Sets $2B Dual Treasury Target Months After Liquidating Bitcoin Holdings Genius…
Bitcoin Magazine Bitcoin Again Flirts With $81,000 Ahead of Fed’s Jackson Hole Meeting Bitcoin again…
Bitcoin Magazine Japanese Bitcoin Industry Unveils ‘Aurora’ to Let Global Anime Fans Support $2 Trillion…