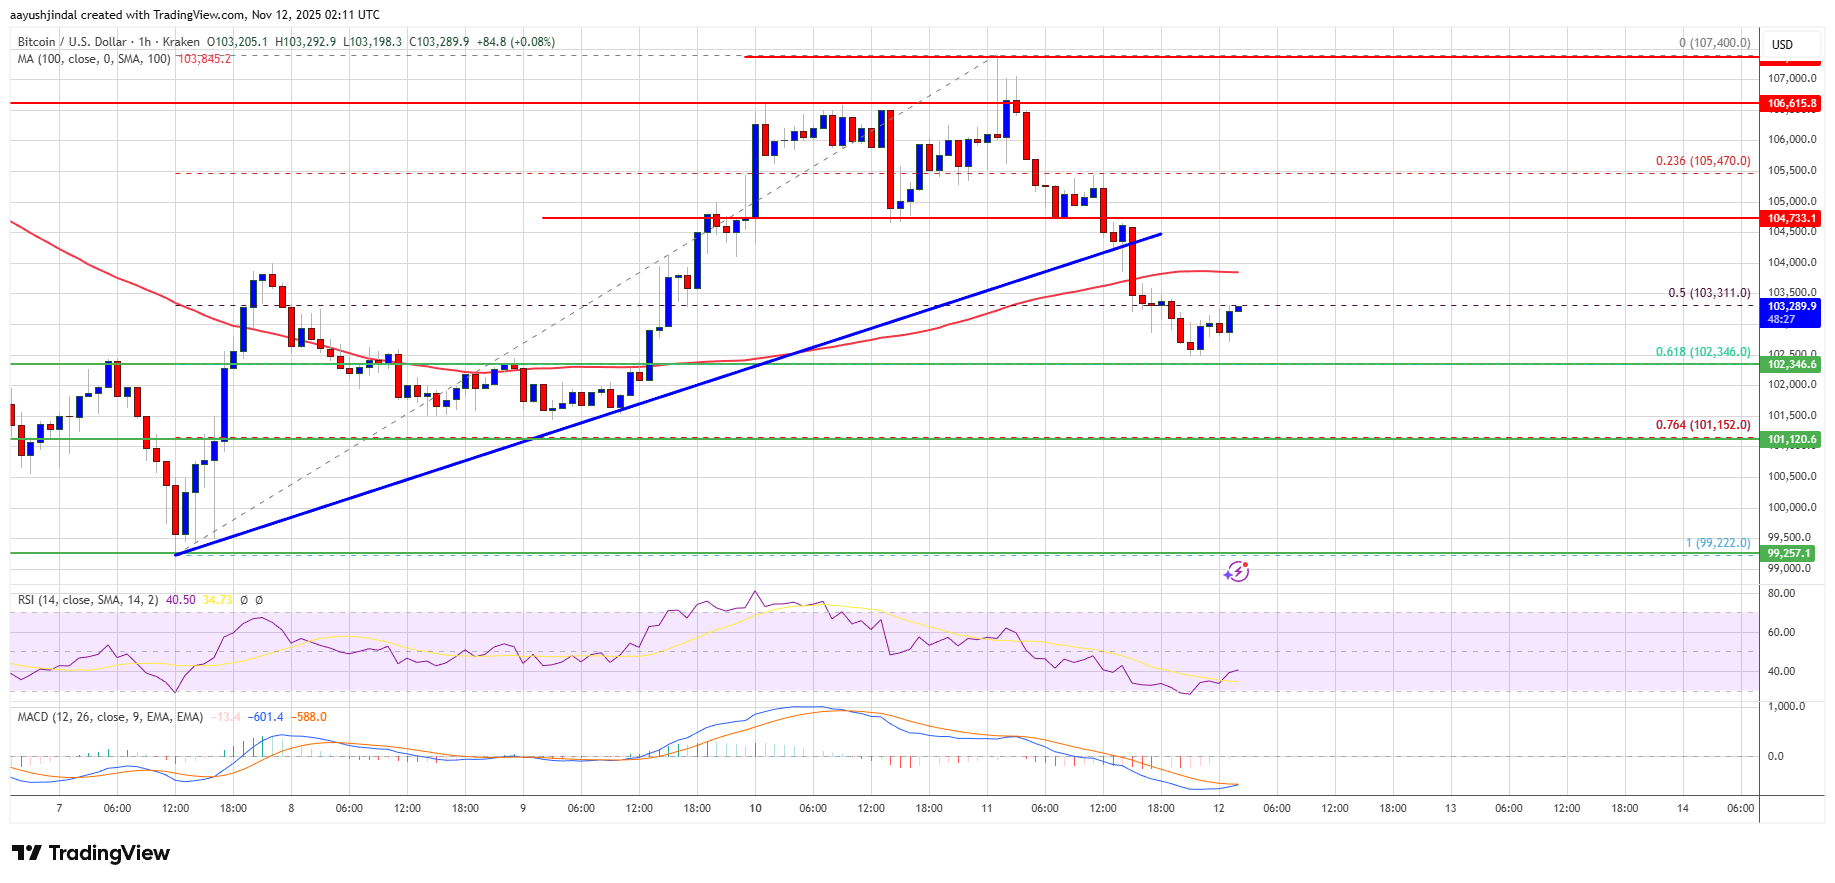
Bitcoin price failed to recover above $107,000. BTC is trimming gains and might could continue to move down if it trades below $102,500.
Bitcoin started a fresh decline after it failed to clear $107,000.
The price is trading below $105,500 and the 100 hourly Simple moving average.
There was a break below a bullish trend line with support at $104,200 on the hourly chart of the BTC/USD pair (data feed from Kraken).
The pair might continue to move down if it settles below the $102,500 zone.
Bitcoin price started a recovery wave above $105,000. BTC recovered above the $105,500 and $106,000 resistance levels. However, the bears remained active near the $107,000 zone.
A high was formed at $107,400 and the price started a fresh decline. There was a drop below the $105,500 and $105,000 levels. The price dipped below the 50% Fib retracement level of the upward move from the $99,222 swing low to the $107,400 high.
Besides, there was a break below a bullish trend line with support at $104,200 on the hourly chart of the BTC/USD pair. Bitcoin is now trading below $105,000 and the 100 hourly Simple moving average.
If the bulls attempt another recovery wave, the price could face resistance near the $104,000 level. The first key resistance is near the $104,750 level. The next resistance could be $105,500. A close above the $105,500 resistance might send the price further higher. In the stated case, the price could rise and test the $107,000 resistance. Any more gains might send the price toward the $107,500 level. The next barrier for the bulls could be $108,800 and $109,500.
If Bitcoin fails to rise above the $105,000 resistance zone, it could start another decline. Immediate support is near the $102,800 level. The first major support is near the $102,400 level and the 61.8% Fib retracement level of the upward move from the $99,222 swing low to the $107,400 high.
The next support is now near the $101,200 zone. Any more losses might send the price toward the $100,200 support in the near term. The main support sits at $100,000, below which BTC might struggle to recover in the near term.
Technical indicators:
Hourly MACD – The MACD is now gaining pace in the bearish zone.
Hourly RSI (Relative Strength Index) – The RSI for BTC/USD is now below the 50 level.
Major Support Levels – $102,500, followed by $101,200.
Major Resistance Levels – $104,000 and $105,000.
[#item_full_content]NewsBTCRead MoreBTC fell in Asia as the Japanese yen tanked to four-decade lows, lifting the dollar…
Bitcoin Magazine Strategy (MSTR) Surges Over 12% As Bitcoin-Linked Stocks Have Green Day Shares of…
The bank said bitcoin lending has emerged from the 2022 crypto credit collapse with stronger…
Loading Tweet… View original post on X TL;DR CryptoQuant flagged that Gate.io’s Bitcoin whale share…
Bitcoin Magazine Fidelity Outlines 5 Factors That Could End the Bitcoin and Crypto Winter Bitcoin…
For more details, visit the official Beincrypto platform. TL;DR XRP spot ETF products reportedly extended…