Bitcoin price started a fresh increase above the $80,000 zone. BTC is now consolidating gains and might correct some to test the $80,500 zone.
Bitcoin started a fresh increase above the $80,000 zone.
The price is trading above $80,500 and the 100 hourly Simple moving average.
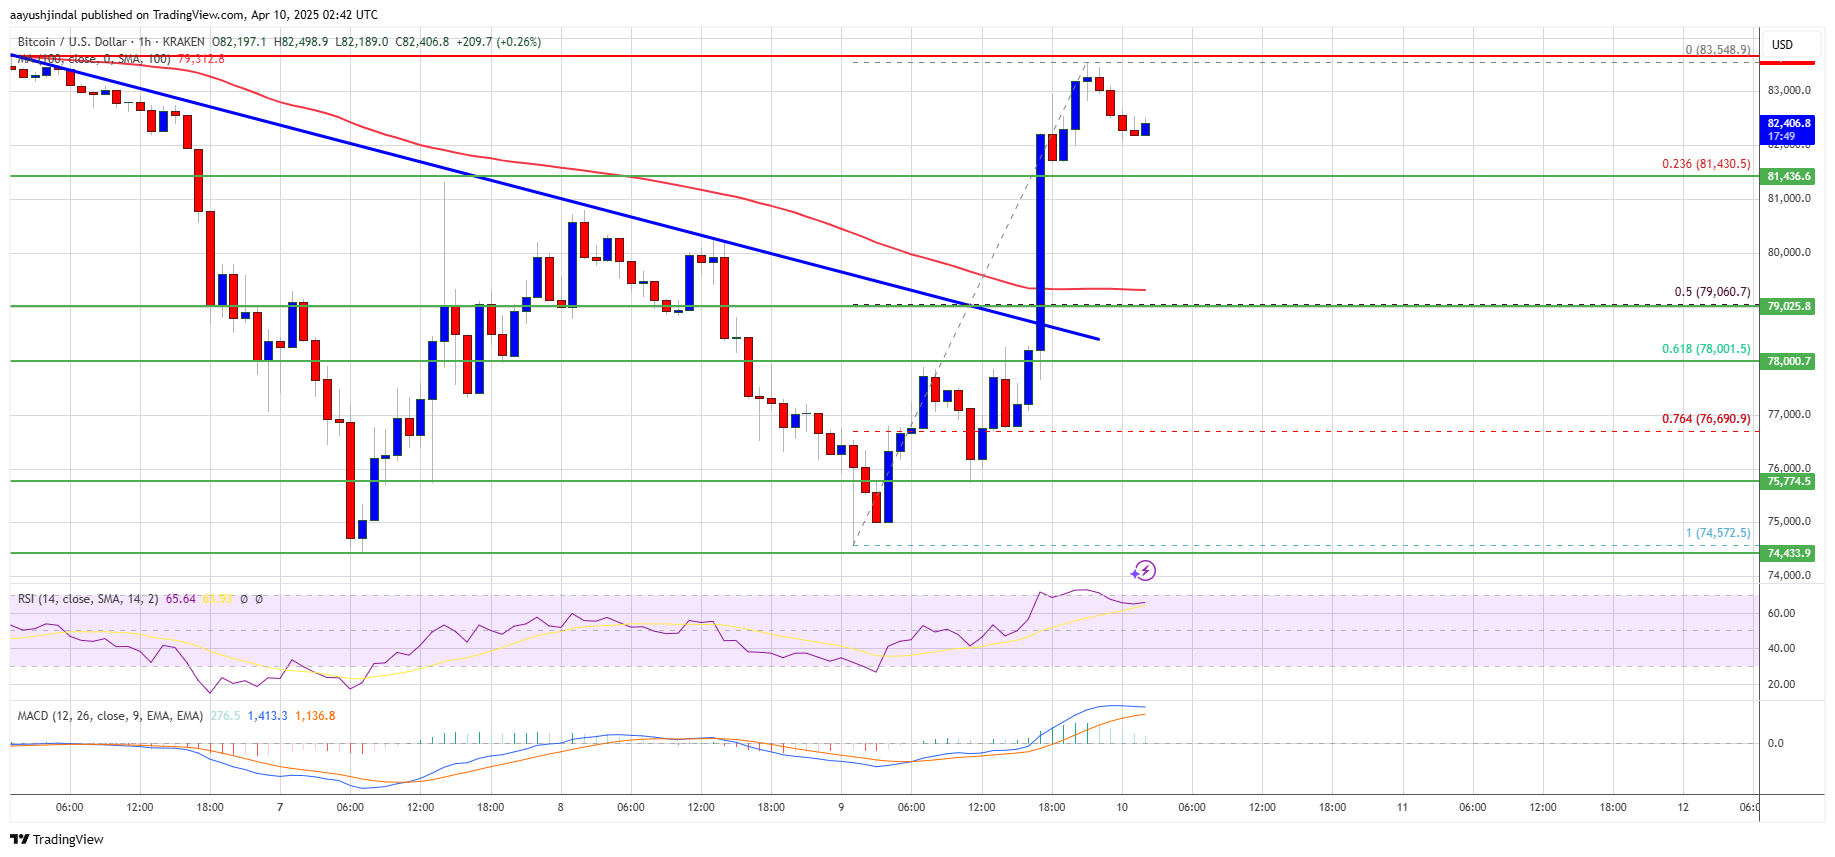
There was a break above a key bearish trend line with resistance at $78,800 on the hourly chart of the BTC/USD pair (data feed from Kraken).
The pair could start another increase if it clears the $83,500 zone.
Bitcoin price started a fresh increase from the $74,500 zone. BTC formed a base and gained pace for a move above the $78,500 and $80,000 resistance levels.
The bulls pumped the price above the $80,500 resistance. There was a break above a key bearish trend line with resistance at $78,800 on the hourly chart of the BTC/USD pair. The pair even cleared the $82,500 resistance zone. A high was formed at $83,548 and the price is now consolidating gains above the 23.6% Fib retracement level of the upward move from the $74,572 swing low to the $83,548 high.
Bitcoin price is now trading above $80,200 and the 100 hourly Simple moving average. On the upside, immediate resistance is near the $83,200 level. The first key resistance is near the $83,500 level.
The next key resistance could be $84,500. A close above the $84,500 resistance might send the price further higher. In the stated case, the price could rise and test the $85,800 resistance level. Any more gains might send the price toward the $88,000 level.
If Bitcoin fails to rise above the $83,500 resistance zone, it could start a downside correction. Immediate support on the downside is near the $81,400 level. The first major support is near the $80,500 level.
The next support is now near the $79,500 zone or the 50% Fib retracement level of the upward move from the $74,572 swing low to the $83,548 high. Any more losses might send the price toward the $78,000 support in the near term. The main support sits at $75,000.
Technical indicators:
Hourly MACD – The MACD is now gaining pace in the bullish zone.
Hourly RSI (Relative Strength Index) – The RSI for BTC/USD is now above the 50 level.
Major Support Levels – $81,400, followed by $80,500.
Major Resistance Levels – $83,500 and $84,500.
[#item_full_content]NewsBTCRead MoreThe cryptocurrency community pushed back, with Michael Saylor saying Bitcoin has no issuer, promoter, or…
Crypto pundit Crypto Bully has shared his base case for Bitcoin and what to expect…
The past week recorded a significant change in the Bitcoin price action, where there was…
The largest publicly traded corporate holder of bitcoin would need to buy roughly 6,158 BTC…
On-chain analytics firm Glassnode has highlighted how Bitcoin has only seen a relatively thin accumulation…
Bitcoin (BTC) made a notable recovery on Friday, witnessing a 4% surge that led the…