Bitcoin price started a fresh decline below the $77,500 zone. BTC is consolidating and might struggle to stay above the $76,000 support.
Bitcoin failed to stay above $77,500 and extended losses.
The price is trading below $77,000 and the 100 hourly simple moving average.
There is a bearish trend line forming with resistance at $76,850 on the hourly chart of the BTC/USD pair (data feed from Kraken).
The pair might extend losses if it stays below the $77,000 and $77,500 levels.
Bitcoin price failed to stay above the $77,500 support zone. BTC remained in a bearish zone and extended losses below the $77,000 level. There was a move below the $76,500 level.
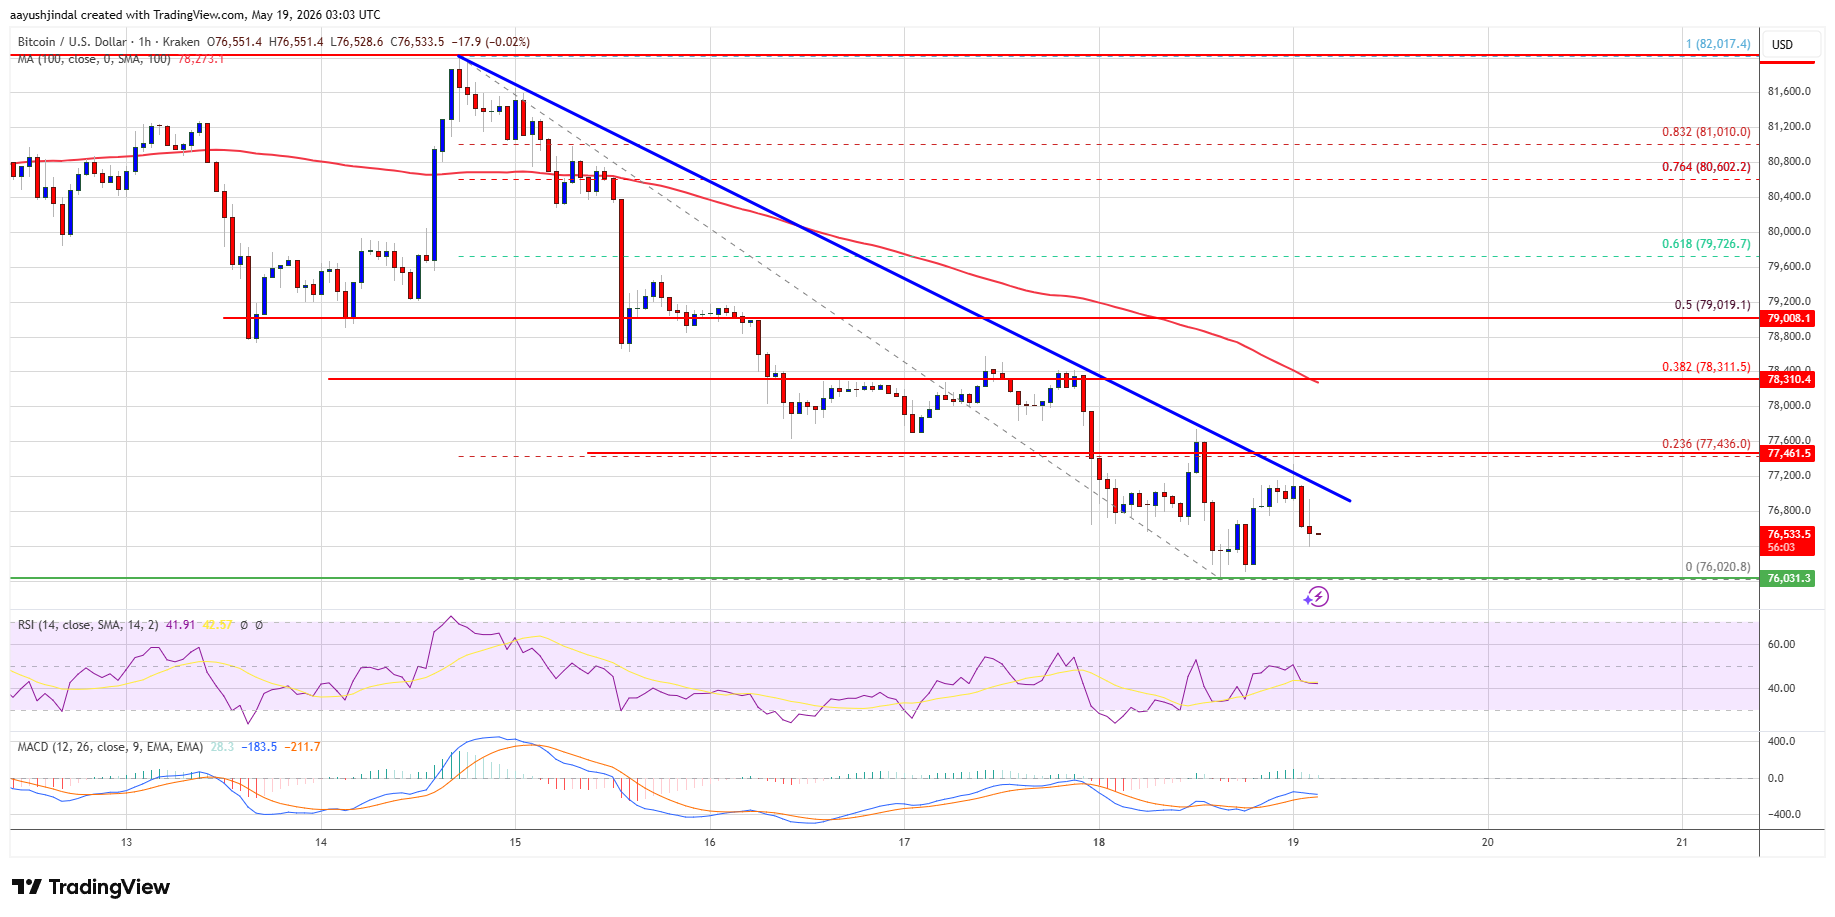
The price even dipped below $76,200. A low was formed at $76,020 and the price is now consolidating losses. It is showing bearish signs below the 23.6% Fib retracement level of the downward move from the $82,018 swing high to the $76,020 low.
Bitcoin is now trading below $77,000 and the 100 hourly simple moving average. If the price remains stable above $76,000, it could attempt a fresh increase. Immediate resistance is near the $77,000 level. There is also a bearish trend line forming with resistance at $76,850 on the hourly chart of the BTC/USD pair.
The first key resistance is near the $78,300 level. A close above the $78,300 resistance might send the price further higher. In the stated case, the price could rise and test the $79,000 resistance or the 50% Fib retracement level of the downward move from the $82,018 swing high to the $76,020 low. Any more gains might send the price toward the $80,000 level. The next barrier for the bulls could be $81,200.
If Bitcoin fails to rise above the $78,300 resistance zone, it could start another decline. Immediate support is near the $76,200 level.
The first major support is near the $76,000 level. The next support is now near the $75,500 zone. Any more losses might send the price toward the $75,000 support in the near term. The main support now sits at $74,200, below which BTC might struggle to recover in the near term.
Technical indicators:
Hourly MACD – The MACD is now gaining pace in the bearish zone.
Hourly RSI (Relative Strength Index) – The RSI for BTC/USD is now below the 50 level.
Major Support Levels – $76,000, followed by $75,000.
Major Resistance Levels – $77,000 and $78,300.
[#item_full_content]NewsBTCRead MoreAt its last stage for government approval, the state's executive council rejected the bond project…
Bitcoin Magazine JPMorgan Says the Real Threat to Bitcoin Isn’t Strategy (MSTR) — It’s Private…
Redemption requests in the $2 trillion private credit market surged to $15.6 billion in the…
Bitcoin Magazine Bitcoin’s New Debt Machine is Facing Its First Major Test Public companies kept…
Compass Point analysts Michael Donovan and Ed Engel said markets are giving little credit to…
Bitcoin Magazine New Hampshire Council Rejects $100 Million Bitcoin-Backed Bond The New Hampshire Executive Council…