Bitcoin price is attempting a fresh increase above the $42,200 level. BTC could surge once it clears the $43,350 resistance zone in the near term.
Bitcoin started a fresh increase above the $42,000 support zone.
The price is trading above $42,200 and the 100 hourly Simple moving average.
There is a key bullish trend line forming with support near $42,400 on the hourly chart of the BTC/USD pair (data feed from Kraken).
The pair could continue to move up if there is a clear move above the $43,350 resistance.
Bitcoin price started a decent increase above the $41,500 level. BTC was able to clear the $42,000 resistance zone to enter a positive zone. The bulls were able to push the price above the $43,000 zone.
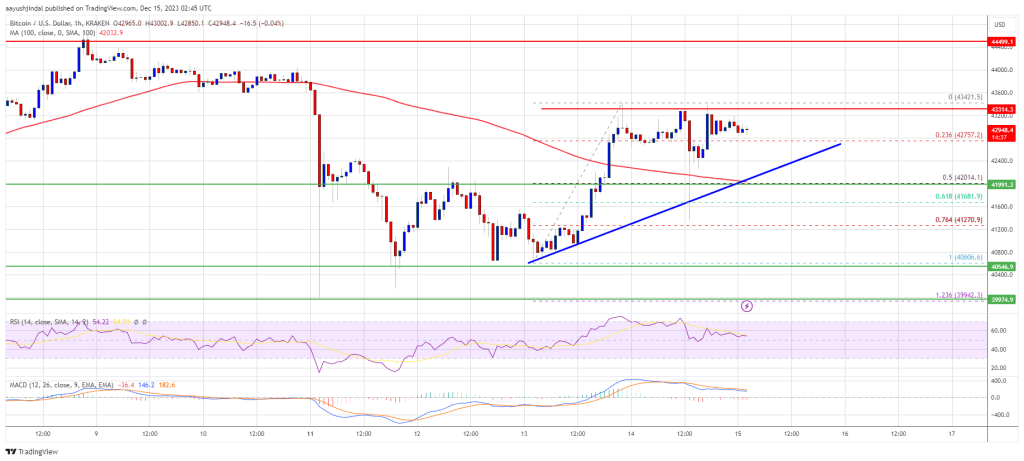
However, the price seems to be struggling near the $43,350 zone. A high was formed near $43,421 and the price is now consolidating gains. There was a sharp downside correction below the $42,500 level. The price even spiked below the 50% Fib retracement level of the upward move from the $40,606 swing low to the $43,421 high.
However, the bulls were active near the $41,500 zone. They protected the 61.8% Fib retracement level of the upward move from the $40,606 swing low to the $43,421 high.
Bitcoin is now trading above $42,200 and the 100 hourly Simple moving average. Besides, there is a key bullish trend line forming with support near $42,400 on the hourly chart of the BTC/USD pair. On the upside, immediate resistance is near the $43,300 level.
Source: BTCUSD on TradingView.com
The first major resistance is forming near $43,350. A close above the $43,350 resistance might start a steady increase. The next key resistance could be near $44,200, above which BTC could rise toward the $45,000 level. A clear move above the $45,000 level could set the pace for a test of $46,500.
If Bitcoin fails to rise above the $43,350 resistance zone, it could start another decline. Immediate support on the downside is near the $42,400 level and the trend line.
The next major support is near $42,000 and the 100 hourly Simple moving average, below which the price might test the $41,500 zone. If there is a move below $41,500, there is a risk of more losses. In the stated case, the price could drop toward the $40,600 support in the near term.
Technical indicators:
Hourly MACD – The MACD is now losing pace in the bullish zone.
Hourly RSI (Relative Strength Index) – The RSI for BTC/USD is now above the 50 level.
Major Support Levels – $42,400, followed by $42,000.
Major Resistance Levels – $43,350, $44,200, and $45,000.
[#item_full_content]NewsBTCRead MoreBitcoin Magazine UBS to Build Digital-Asset Infrastructure, Eyes Bitcoin Services for Individuals UBS Group AG…
The cryptocurrency is trading below key ETF cost levels and nearing its pre-election price floor…
Shares of mining companies rose last month despite softer bitcoin prices as storms cut the…
Convergence between bitcoin supply in profit and supply in loss has repeatedly coincided with major…
Your day-ahead look for Feb. 4, 2026Read MoreCoinDesk: Bitcoin, Ethereum, Crypto News and Price Data[#item_full_content]
Limited historical trading activity and thin onchain supply suggest further consolidation or a retest of…