Bitcoin price started a decent increase above $68,000 but failed at $70,000. BTC is now consolidating and might aim for more gains above $69,200.
Bitcoin started a fresh increase after it settled above the $67,500 support.
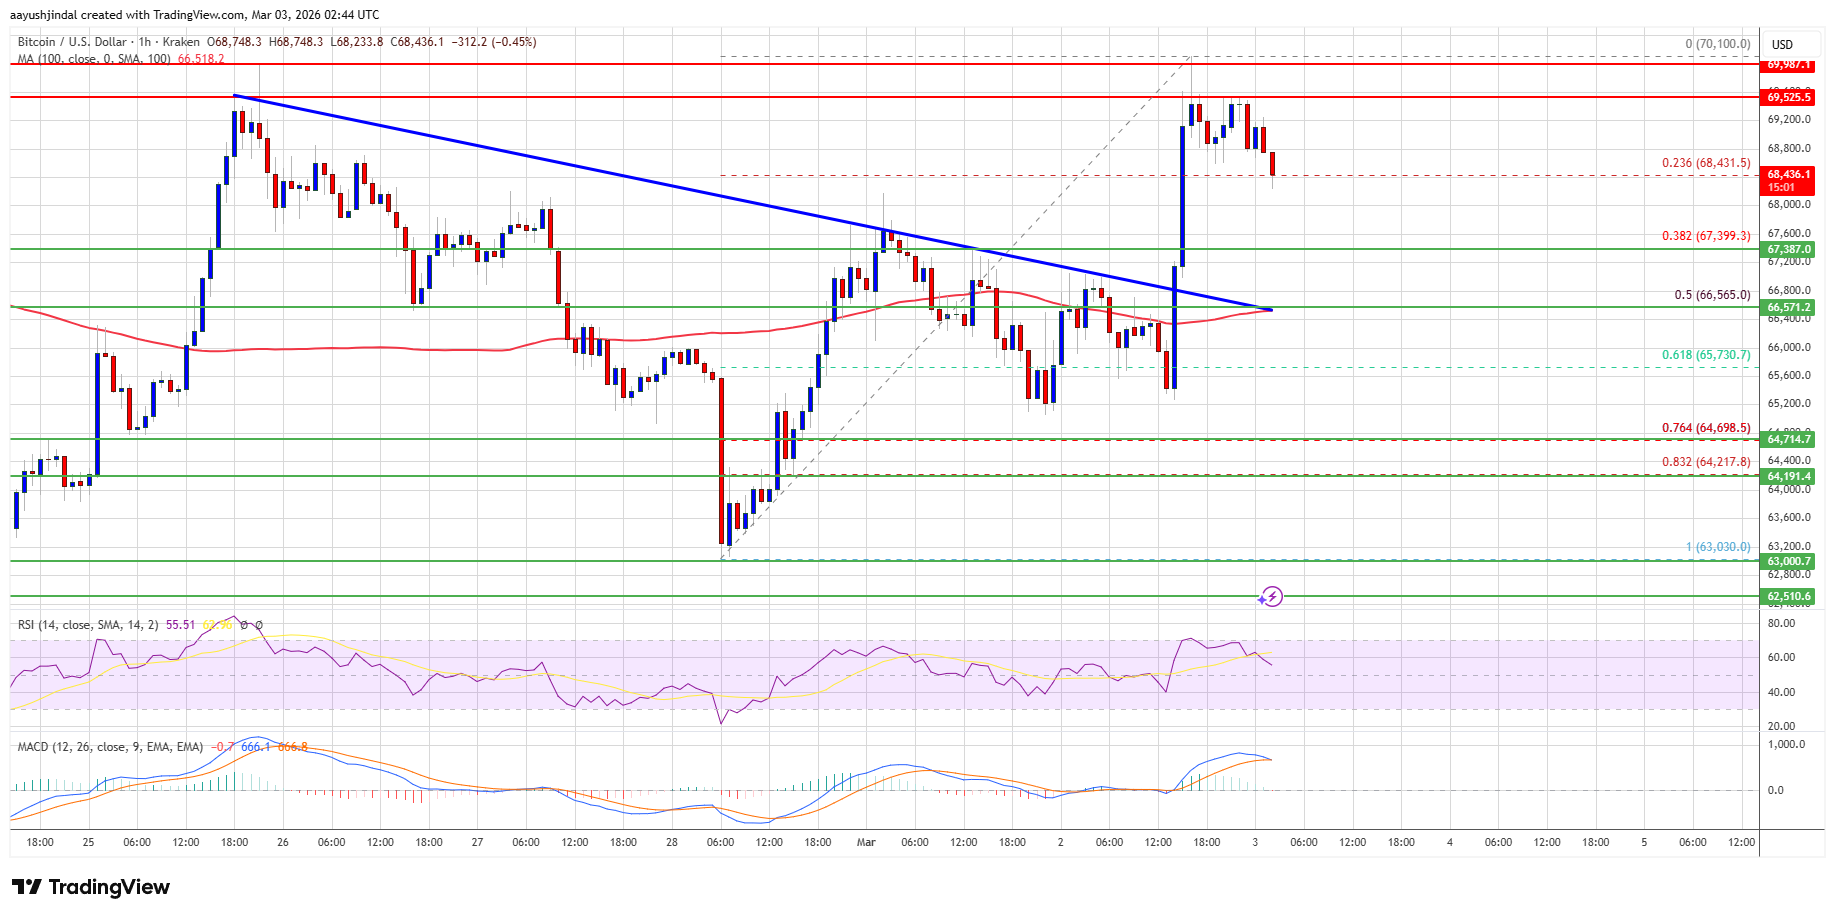
The price is trading above $68,000 and the 100 hourly simple moving average.
There was a break above a bearish trend line with resistance at $66,800 on the hourly chart of the BTC/USD pair (data feed from Kraken).
The pair might dip again if it trades below the $67,400 and $67,000 levels.
Bitcoin price managed to form a base above the $65,500 zone. BTC started a fresh increase and was able to surpass the $66,500 resistance zone.
The price even rallied above the $68,000 resistance. Besides, there was a break above a bearish trend line with resistance at $66,800 on the hourly chart of the BTC/USD pair. Finally, the bears appeared near $70,000. A high was formed at $70,100, and the price recently corrected some gains. There was a move below the 23.6% Fib retracement level of the upward move from the $63,030 swing low to the $70,100 high.
Bitcoin is now trading above $68,000 and the 100 hourly simple moving average. If the price remains stable above $67,500, it could attempt a fresh increase. Immediate resistance is near the $69,200 level.
The first key resistance is near the $69,500 level. A close above the $69,500 resistance might send the price further higher. In the stated case, the price could rise and test the $70,000 resistance. Any more gains might send the price toward the $70,500 level. The next barrier for the bulls could be $70,850 and $71,200.
If Bitcoin fails to rise above the $70,000 resistance zone, it could start another decline. Immediate support is near the $68,000 level. The first major support is near the $67,500 level or the 50% Fib retracement level of the upward move from the $63,030 swing low to the $70,100 high.
The next support is now near the $65,650 zone. Any more losses might send the price toward the $65,000 support in the near term. The main support now sits at $64,200, below which BTC might struggle to recover in the near term.
Technical indicators:
Hourly MACD – The MACD is now losing pace in the bullish zone.
Hourly RSI (Relative Strength Index) – The RSI for BTC/USD is now above the 50 level.
Major Support Levels – $68,000, followed by $67,500.
Major Resistance Levels – $69,200 and $70,000.
[#item_full_content]NewsBTCRead MoreBitcoin (BTC) has wrapped up February with its fifth straight monthly loss, marking only the…
Crypto Exchange-Traded Products (ETPs), led by Bitcoin (BTC) funds, have broken their one-month negative streak…
Bitcoin has remained in a consolidation phase since its early February breakdown below the $70,000…
The Bitcoin and Ethereum prices plunged sharply over the weekend as missiles flew across the…
Post ContentRead MoreCoinDesk: Bitcoin, Ethereum, Crypto News and Price Data[#item_full_content]
A Bitcoin block signaling the BIP-110 proposal has appeared onchain while critics push back by…