Bitcoin price is struggling below the $26,500 resistance. BTC could accelerate lower if there is a close below the $26,000 support in the near term.
Bitcoin is struggling and trading well below the $27,500 resistance.
The price is trading below $26,500 and the 100 hourly Simple moving average.
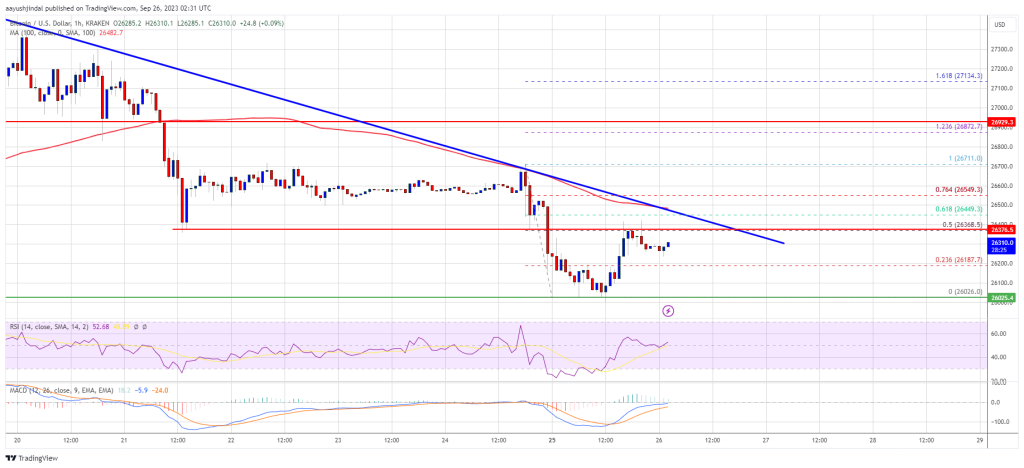
There is a key bearish trend line forming with resistance near $26,420 on the hourly chart of the BTC/USD pair (data feed from Kraken).
The pair could resume its decline unless there is a close above the $26,500 level.
Bitcoin price started a fresh decline below the $26,800 level. BTC traded below the $26,500 and $26,200 support levels to move into a negative zone.
Finally, the pair tested $26,000 and a low was formed near $26,026. Recently, the price started a minor recovery wave above the $26,200 level. The price climbed above the 23.6% Fib retracement level of the recent drop from the $26,712 swing high to the $26,026 low.
However, the bears are protecting a break above the $26,500 resistance. The price is struggling to clear the 50% Fib retracement level of the recent drop from the $26,712 swing high to the $26,026 low.
Bitcoin is now trading below $26,500 and the 100 hourly Simple moving average. Immediate resistance on the upside is near the $26,400 level. There is also a key bearish trend line forming with resistance near $26,420 on the hourly chart of the BTC/USD pair.
Source: BTCUSD on TradingView.com
The next key resistance could be near the $26,500 level, above which the price could gain bullish momentum. In the stated case, the price could climb toward the $27,000 resistance. Any more gains might call for a move toward the $27,500 level.
If Bitcoin fails to start a fresh increase above the $26,500 resistance, it could continue to move down. Immediate support on the downside is near the $26,150 level.
The next major support is near the $26,000 level. A downside break and close below the $26,000 level might start another major decline maybe toward the next support at $25,400. Any more losses might call for a test of $25,000.
Technical indicators:
Hourly MACD – The MACD is now losing pace in the bearish zone.
Hourly RSI (Relative Strength Index) – The RSI for BTC/USD is now below the 50 level.
Major Support Levels – $26,150, followed by $26,000.
Major Resistance Levels – $26,400, $26,500, and $27,000.
[#item_full_content]NewsBTCRead MoreBitcoin Magazine Kalshi Pushes Deeper Into Crypto Derivatives With Bitcoin-Backed Margin Loans Kalshi is doubling…
Bitcoin Magazine Beyond HODLing: How Bitcoin-Backed Loans Can Unlock New Financial Opportunities For long-term Bitcoin…
Bitcoin Magazine Bitcoin Nears $85,000 as SpaceX Earnings Reignite Risk Appetite Bitcoin’s price rose above…
Bitcoin Magazine Strive’s SATS: How 15% Yield Becomes A Bitcoin Accretion Machine Strive’s newly IPO’d…
📺 Watch Video Bitcoin Magazine J.P. Morgan Reveals First-Ever Bitcoin Price Forecast in Long-Term Capital…
📺 Watch Video Bitcoin Magazine Jeff Walton: Where the Next Trillion Dollars for Bitcoin Comes…