Bitcoin price failed to start a recovery wave above the $61,500 resistance zone. BTC started another decline and might dive toward $55,000.
Bitcoin started a fresh decline and traded below the $58,500 zone.
The price is trading below $60,000 and the 100 hourly Simple moving average.
There is a key bearish trend line forming with resistance at $58,350 on the hourly chart of the BTC/USD pair (data feed from Kraken).
The pair might struggle to start a fresh increase above the $60,000 resistance zone.
Bitcoin price struggled to start a decent recovery wave above the $61,500 resistance level. The bears remained in action and pushed BTC below the $60,000 support zone. There was a sharp decline below the $58,500 level.
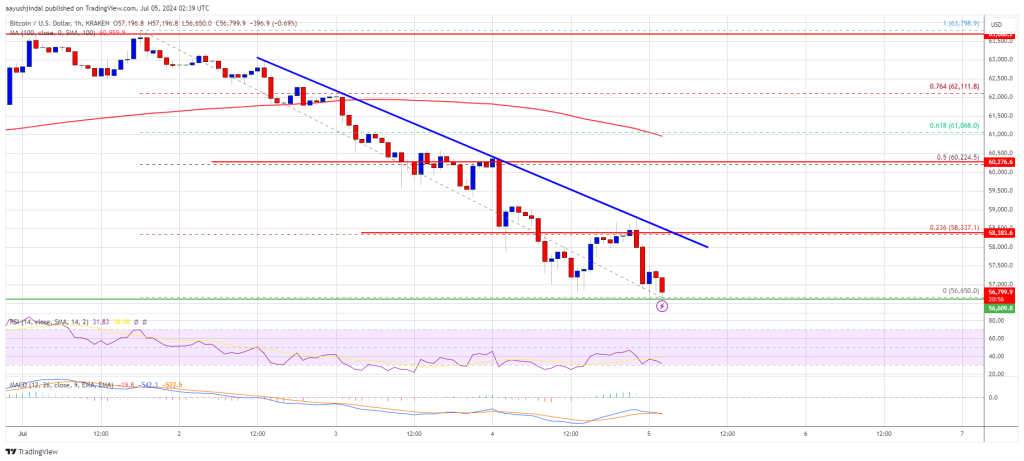
The price even spiked below the $57,000 level. A low was formed at $56,650 and the price is now consolidating losses. It seems like the bulls are struggling to start a recovery wave from the $56,650 level as the price is now well below the 23.6% Fib retracement level of the downward move from the $63,800 swing high to the $56,650 low.
Bitcoin price is now trading below $60,000 and the 100 hourly Simple moving average. There is also a key bearish trend line forming with resistance at $58,350 on the hourly chart of the BTC/USD pair.
If there is a decent increase, the price could face resistance near the $57,500 level. The first key resistance is near the $58,350 level and the trend line. A clear move above the trend line might send the price toward the $60,000 level.
The next key resistance could be $60,200 and the 50% Fib retracement level of the downward move from the $63,800 swing high to the $56,650 low. A clear move above the $60,200 resistance might start a steady increase and send the price higher. In the stated case, the price could rise and test the $61,500 resistance.
If Bitcoin fails to climb above the $58,350 resistance zone, it could continue to move down. Immediate support on the downside is near the $56,650 level.
The first major support is $56,200. The next support is now forming near $55,800. Any more losses might send the price toward the $55,000 support zone in the near term.
Technical indicators:
Hourly MACD – The MACD is now gaining pace in the bearish zone.
Hourly RSI (Relative Strength Index) – The RSI for BTC/USD is now below the 50 level.
Major Support Levels – $56,650, followed by $55,000.
Major Resistance Levels – $58,350, and $60,000.
[#item_full_content]NewsBTCRead MoreBitcoin Magazine Japan Moves to Classify Bitcoin and Crypto as Financial Instruments Under New Bill…
Headline inflation rose 0.9% last month, driven by the sharp rise in energy costs due…
A crypto analyst has shared two interesting scenarios she believes that the Bitcoin price could…
Institutions are betting on the bitcoin price hitting $80,000 through call options, but they are…
Experts say XRP’s design leaves a smaller share of its supply exposed to a potential…
Traders face a pivotal Friday as narrowing volatility on bitcoin's chart hints at a massive…