Bitcoin price extended its decline below the $65,000 support. BTC is now struggling to stay above the $62,000 support zone and might test $60,000.
Bitcoin price is moving lower below the $64,000 support zone.
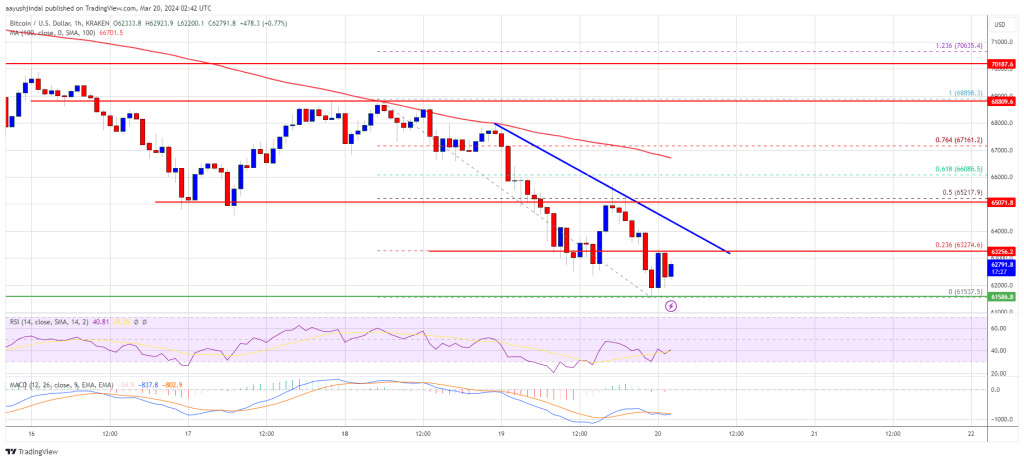
The price is trading below $63,500 and the 100 hourly Simple moving average.
There is a connecting bearish trend line forming with resistance at $63,300 on the hourly chart of the BTC/USD pair (data feed from Kraken).
The pair could start a decent upward move if it clears the $65,200 resistance zone in the near term.
Bitcoin price remained in a short-term bearish zone below the $66,500 zone. BTC traded below the $65,000 and $64,000 support levels to set a new weekly low.
There was a push below the $62,500 support. A low was formed near $61,537 and the price is now consolidating losses. The price is now struggling below the 23.6% Fib retracement level of the recent decline from the $68,898 swing high to the $61,537 low.
Bitcoin is now trading below $63,500 and the 100 hourly Simple moving average. Immediate resistance is near the $63,300 level. There is also a connecting bearish trend line forming with resistance at $63,300 on the hourly chart of the BTC/USD pair.
Source: BTCUSD on TradingView.com
The first major resistance could be $64,000. If there is a clear move above the $64,000 resistance zone, the price could even attempt a move toward the $65,200 resistance zone. It is close to the 50% Fib retracement level of the recent decline from the $68,898 swing high to the $61,537 low. Any more gains might send the price toward the $67,000 level.
If Bitcoin fails to rise above the $63,300 resistance zone, it could continue to move down. Immediate support on the downside is near the $62,000 level.
The first major support is $61,500. The next support sits at $60,500. If there is a close below $60,500, the price could start a drop toward the $60,000 level. Any more losses might send the price toward the $58,800 support zone in the near term.
Technical indicators:
Hourly MACD – The MACD is now gaining pace in the bearish zone.
Hourly RSI (Relative Strength Index) – The RSI for BTC/USD is now below the 50 level.
Major Support Levels – $61,500, followed by $60,000.
Major Resistance Levels – $63,300, $64,000, and $65,200.
[#item_full_content]NewsBTCRead MoreBloomberg Intelligence senior commodity strategist Mike McGlone said bitcoin could still fall back toward and…
BTC holds near $70,000 and outperforms major assets during Middle East tensions, even as derivatives…
Two Prime CEO Alexander Blume says the high yield product driving the buying surge carries…
Your day-ahead look for March 12, 2026Read MoreCoinDesk: Bitcoin, Ethereum, Crypto News and Price Data[#item_full_content]
The futures-to-spot ratio has climbed to 5.1, reflecting a structural shift in how the market…
Bitcoin traded around $69,800 as open interest rose to $102 billion, suggesting defensive, bearish bets…