Bitcoin price failed to recover above the $65,500 resistance. BTC is again moving lower and there is a risk of more downsides below $63,000.
Bitcoin started another decline after it failed to surpass the $65,500 resistance zone.
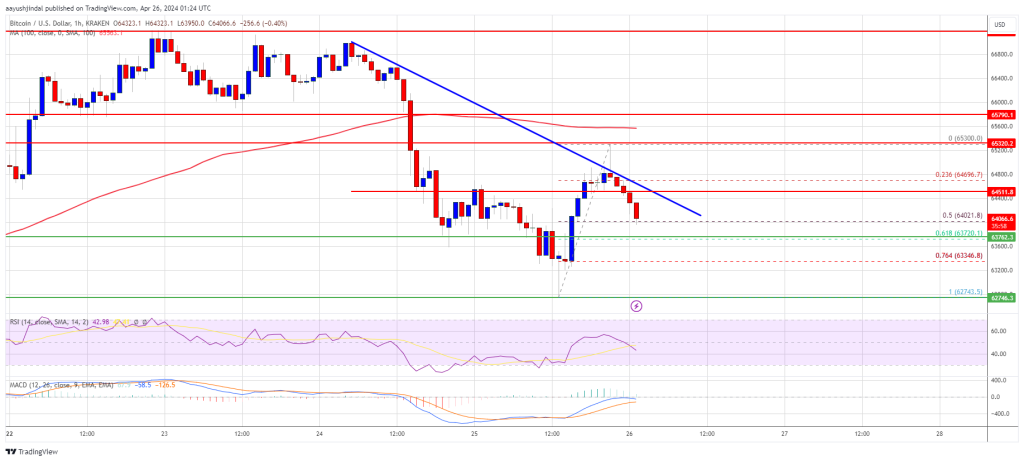
The price is trading below $64,500 and the 100 hourly Simple moving average.
There is a connecting bearish trend line forming with resistance at $64,500 on the hourly chart of the BTC/USD pair (data feed from Kraken).
The pair could accelerate lower if there is a daily close below the $63,000 support zone.
Bitcoin price started a recovery wave from the $62,750 support zone. BTC was able to climb above the $64,000 and $64,500 resistance levels. However, the price failed to clear the $65,500 resistance zone.
A high was formed at $65,300 and the price started another decline. There was a move below the $64,500 level. The price tested the 50% Fib retracement level of the recovery wave from the $62,743 swing low to the $65,300 high.
Bitcoin is now trading below $64,500 and the 100 hourly Simple moving average. There is also a connecting bearish trend line forming with resistance at $64,500 on the hourly chart of the BTC/USD pair.
Immediate resistance is near the $64,500 level or the trend line. The first major resistance could be $65,350 or $65,500. A clear move above the $65,500 resistance might send the price higher. The next resistance now sits at $66,200.
Source: BTCUSD on TradingView.com
If there is a clear move above the $66,200 resistance zone, the price could continue to move up. In the stated case, the price could rise toward $67,000. The next major resistance is near the $67,400 zone. Any more gains might send Bitcoin toward the $68,800 resistance zone in the near term.
If Bitcoin fails to rise above the $64,500 resistance zone, it could continue to move down. Immediate support on the downside is near the $64,000 level.
The first major support is $63,750 or the 61.8% Fib retracement level of the recovery wave from the $62,743 swing low to the $65,300 high. If there is a close below $63,750, the price could start to drop toward $62,750. Any more losses might send the price toward the $61,200 support zone in the near term.
Technical indicators:
Hourly MACD – The MACD is now gaining pace in the bearish zone.
Hourly RSI (Relative Strength Index) – The RSI for BTC/USD is now below the 50 level.
Major Support Levels – $64,000, followed by $63,750.
Major Resistance Levels – $64,500, $65,350, and $66,200.
[#item_full_content]NewsBTCRead MoreFalling oil prices are helping, but a bounce seemed in the cards after some of…
Bitcoin Magazine Bitcoin Price Reclaims $73,000 as War Shakes Markets, Outperforming Gold and Stocks The…
Capriole Investments founder Charles Edwards says Bitcoin has moved into a historically attractive accumulation area,…
BTC climbed 2% to break through $72,000 while U.S. equity futures slipped and the dollar…
Your day-ahead look for March 13, 2026Read MoreCoinDesk: Bitcoin, Ethereum, Crypto News and Price Data[#item_full_content]
Stronger dollar, rising Treasury yields, and tech equities treading water contrast with bitcoin’s resilience amid…