Bitcoin price is correcting gains from the $64,000 resistance. BTC might find strong support near the $59,250 level or the 100 hourly SMA.
Bitcoin price is correcting gains below the $62,250 resistance zone.
The price is trading above $60,000 and the 100 hourly Simple moving average.
There was a break below a connecting bullish trend line with support at $62,850 on the hourly chart of the BTC/USD pair (data feed from Kraken).
The pair could correct lower toward $60,000 or even to the 100 hourly Simple moving average.
Bitcoin price extended its rally above the $62,000 resistance zone. BTC even cleared the $63,200 level and tested the $64,000 zone. A new multi-week high was formed near $64,000 before the price started a downside correction.
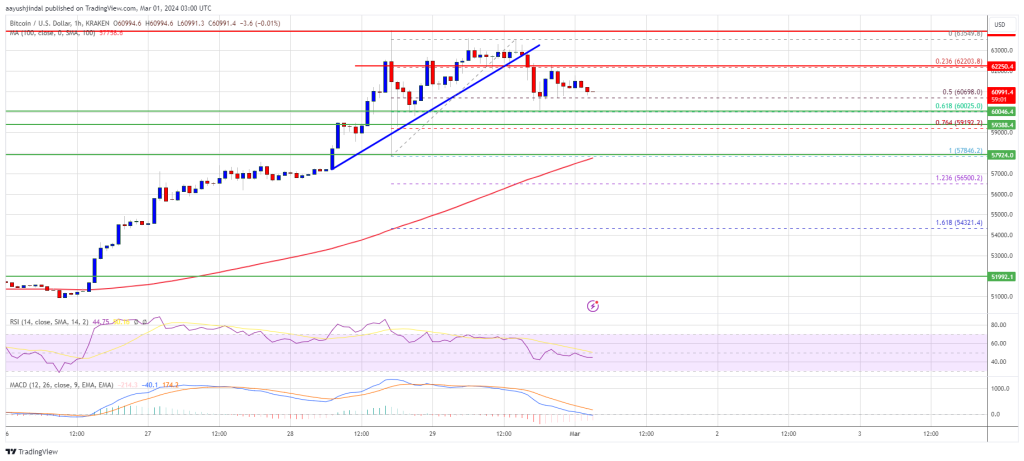
The price traded below the $62,000 support. There was a spike below the 50% Fib retracement level of the upward move from the $57,846 swing low to the $53,549 swing high.
There was a break below a connecting bullish trend line with support at $62,850 on the hourly chart of the BTC/USD pair. Bitcoin is still trading above $60,000 and the 100 hourly Simple moving average.
Source: BTCUSD on TradingView.com
Immediate resistance is near the $62,200 level. The next key resistance could be $62,850, above which the price could rise toward the $64,000 resistance zone. If the bulls remain in action, the price could even surpass $64,000 and test $65,000. Any more gains might send the price toward the $68,000 zone.
If Bitcoin fails to rise above the $62,200 resistance zone, it could continue to move down. Immediate support on the downside is near the $60,000 level and the 61.8% Fib retracement level of the upward move from the $57,846 swing low to the $53,549 swing high.
The first major support is $58,000 or the 100 hourly SMA. If there is a close below $58,000, the price could start a decent pullback toward the $56,500 zone. Any more losses might send the price toward the $55,000 support zone.
Technical indicators:
Hourly MACD – The MACD is now losing pace in the bullish zone.
Hourly RSI (Relative Strength Index) – The RSI for BTC/USD is now below the 50 level.
Major Support Levels – $60,000, followed by $58,000.
Major Resistance Levels – $62,200, $62,850, and $64,000.
[#item_full_content]NewsBTCRead MoreBitcoin (BTC) resumed its downward trajectory on Thursday, falling toward $65,645 at the time of…
The Bitcoin price crash toward $60,000 has sparked debate across the crypto market, but recent…
The strong correlation between crypto and the software sector reasserted itself on WednesdayRead MoreCoinDesk: Bitcoin,…
Bitcoin Magazine Thailand Moves to Cement Bitcoin and Digital Assets in Regulated Derivatives Market Thailand…
Bitcoin Magazine Strategy (MSTR) Accounted for 97.5% of Corporate Bitcoin Buying Last Month, Report Shows…
Bitcoin’s violent drawdown into the low-$60,000s has traders hunting for a floor. One of the…